133
Honour Lectures /
Conférences honorifiques
7
used in high-level radioactive waste (HLRW) disposal, the
vast majority of these studies have been laboratory scale
studies (e.g., Crooks and Quigley 1984, Gillham et al.
1984, Shackelford et al. 1989, Shackelford and Daniel
1991b, Rowe and Badv 1996a,b, Cotten et al. 1998, Roehl
and Czurda 1998, Foged and Baumann 1999, Headley et
al. 2001, Rossanne et al. 2003, Çamur and Yazicigil
2005, Frempong and Yanful 2008, Hong et al. 2009, Korf
et al. 2011, De Soto et al. 2012). By comparison, relatively
few field-scale studies of diffusion in compacted clay
barriers have been reported, primarily because the extent of
contaminant migration under diffusion dominated
conditions would not be sufficient within the operational
time-frame of most barriers to allow for such evaluation
without violating the integrity of the barrier via core
sampling. However, two exceptions to this restriction are
the Keele Valley Landfill (KVL) located north of Toronto
in Maple, Canada, which was operational between 1984
and 2002 (Rowe 2005), and a field-scale CCL that was
specifically constructed as a field research study on the
campus of the University of Illinois to evaluate
contaminant transport through CCLs and was operational
for 13 yr (1988-2001) (Cartwright and Krapac 1990,
Toupiol et al. 2002, Willingham et al. 2004).
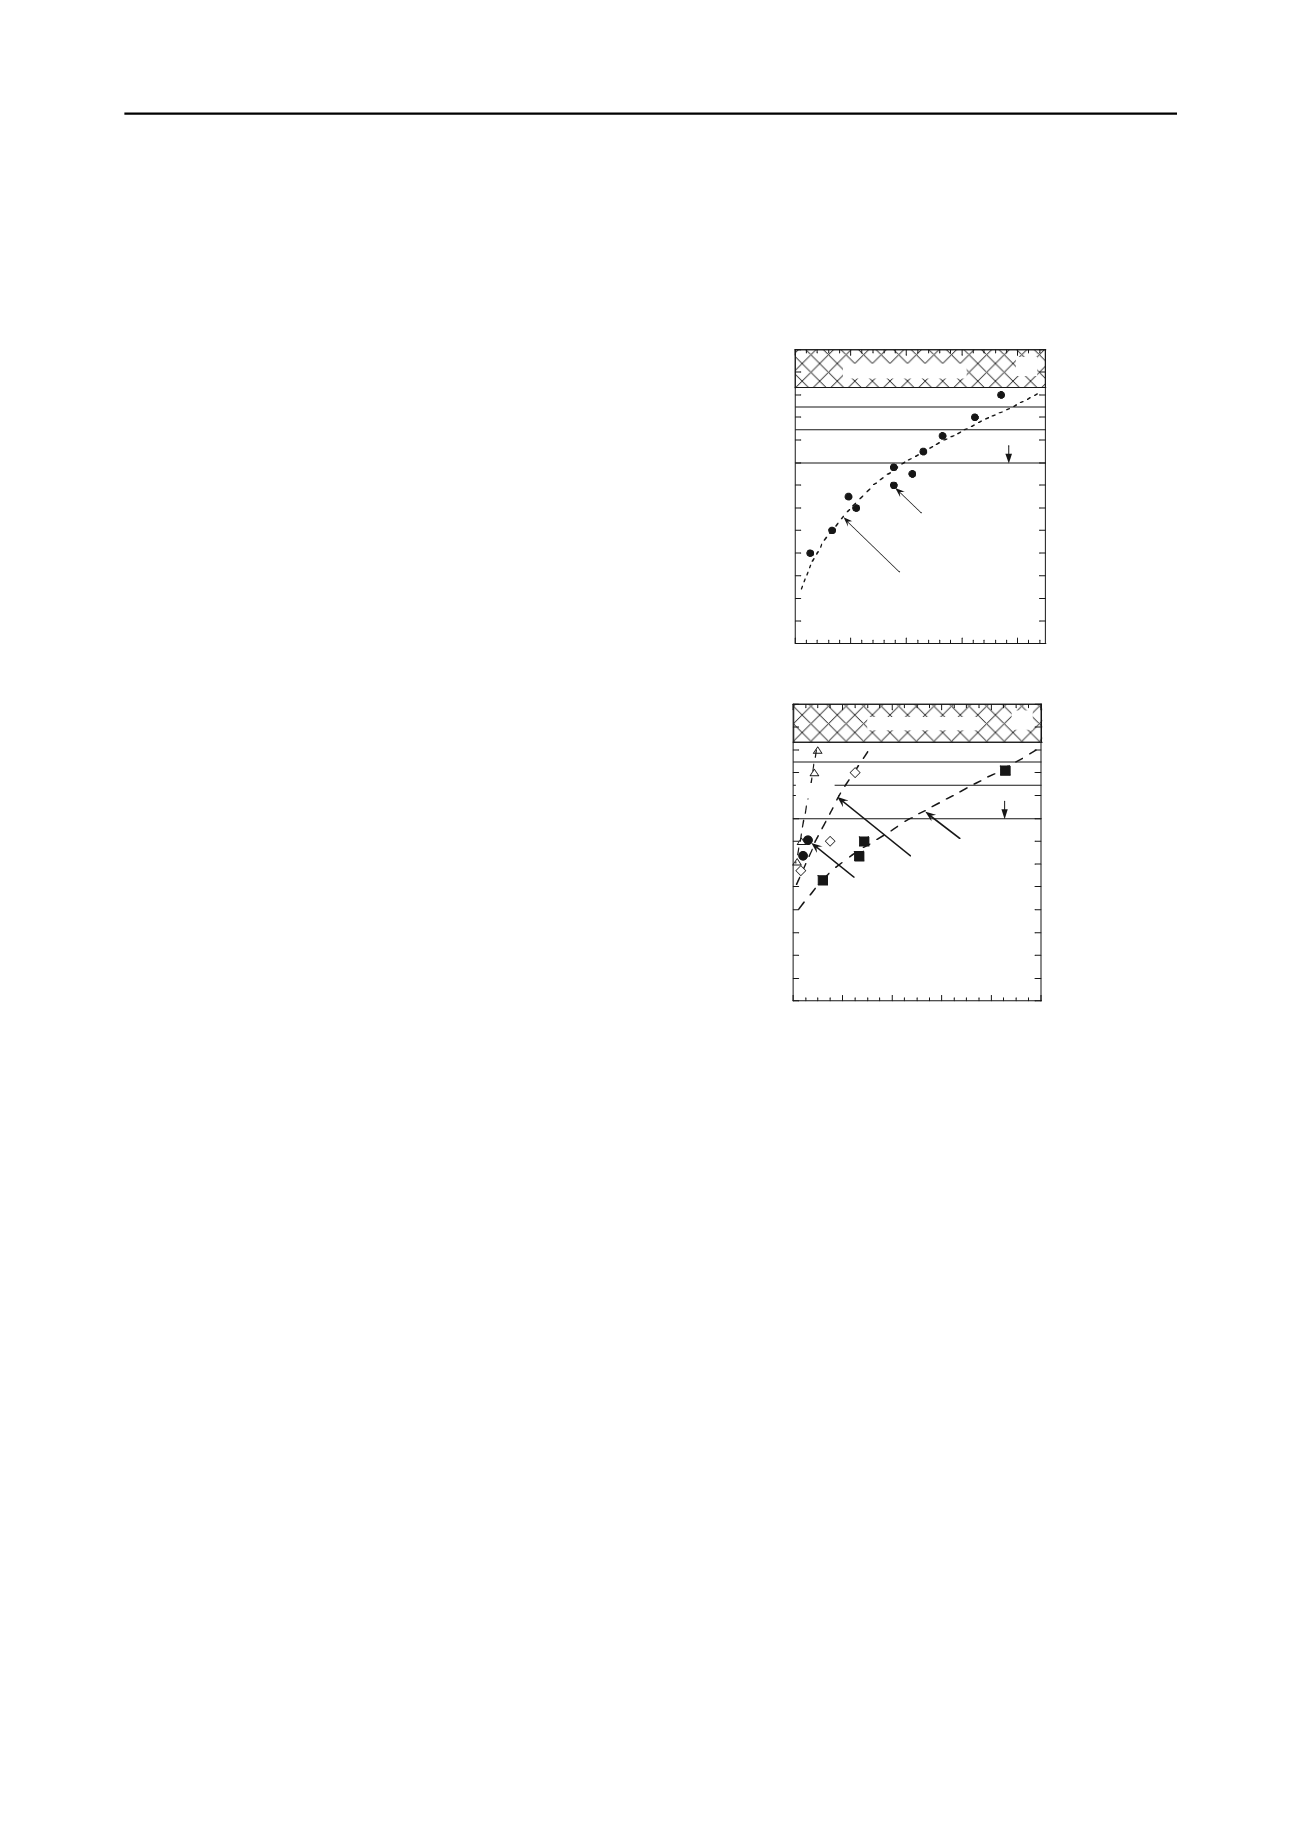
Concentration profiles existing across the interface of
sand overlying the clay liner at the KVL after 4.25 yr of
operation are shown in Fig. 5. The profiles in Fig. 5a are
for chloride, whereas those in Fig. 5b pertain to a group of
VOCs known as the BTEX compounds (benzene, toluene,
ethylbenezene, and xylene). The liner generally was 1.2 m
in thickness, with a
k
h
that was regulated to be 10
-10
m/s or
less (King et al. 1993). The sand overlying the clay liner
was meant primarily to be a protection layer for the
underlying clay liner, and the upper portion of the sand
layer became clogged within the first four years such that
the sand layer did not contribute to the hydraulic
performance of the leachate collection system (Rowe
2005). This clogging resulted in a lack of flow through the
sand layer, such that the sand layer actually served as part
of the low-permeability barrier system whereby diffusion
was the dominant transport process. For example, Rowe
(2005) reported that, in the case of the chloride
concentration profile (Fig. 5a), the assumption of purely
diffusive transport using a
D
*
value for chloride of 6 x 10
-
10
m
2
/s resulted in a predicted profile that matched the
measured profile well, and that the concentration profiles
for the BTEX compounds, especially toluene, through both
the sand and the clay resembled those for diffusion
dominated conditions.
A detailed description of the construction and
installation of monitoring for the prototype CCL
constructed as a research project at the University of
Illinois can be found in Cartwright and Krapac (1990). The
compacted liner was approximately 0.9-m thick and was
constructed using Batestown Till compacted wet of
optimum water content. The dimensions of the liner
facility were 10 m x 17 m x 1 m, which included an
instrumented and ponded test area of 7.3 m x 14.6 m x 0.9
m (Willingham et al. 2004). The entire facility was
enclosed within a heated shelter to minimize weather
effects and prevent infiltration from rainfall. As part of the
monitoring system, large-ring infiltrometers (LRI), 1.5 m
in diameter were installed on the surface of the liner and
subsequently filled to a depth of 0.295 m with water tagged
with tracers (tritium, (HTO) and bromide (Br
-
)).
Approximately one year later, the water level was raised to
0.31 m and maintained at that level for about 8.5 yr, and
then the water level was allowed to decrease due to
evaporation and infiltration, but never reached the liner
surface before the study was terminated (Willingham et al.
2004).
-0.5
-0.4
-0.3
-0.2
-0.1
0
0.1
0.2
0.3
0.4
0.5
0.6
0.7
0.8
(a)
0 1000 2000 3000 4000
Depth from Sand-Clay Interface (m)
Chloride Concentration,
C
(mg/L)
Measured Data
Computed Diffusion Profile
(
D*
= 6.5 x 10
-10
m
2
/s,
t
= 4.25 yr)
Reduced Gray Sand
Light Brown Sand
Brown
Clayey
Liner
Interface
Black Sand
Municipal Solid Waste
-0.5
-0.4
-0.3
-0.2
-0.1
0
0.1
0.2
0.3
0.4
0.5
0.6
0.7
0.8
0 200 400 600 800 1000
(b)
Depth from Sand-Clay Interface (m)
VOC Concentration,
C
(
g/L)
Toluene
Interface
Municipal Solid Waste
Black Sand
Reduced Gray Sand
Brown
Clayey
Liner
Light Brown Sand
Benzene
Ethylbenzene
Xylene
Figure 5. Concentration profiles within the engineered barrier
system at the Keele Valley Landfill, Maple, Ontario, Canada: (a)
chloride concentration profiles (modified after King et al. 1993);
(b) concentration profiles for VOCs (modified after Rowe 2005).
A cross-sectional schematic for the LRI set-up is
illustrated in Fig. 6a, and concentrations profiles of Br
-
as a
function of depth and radial distance,
r
, from the centerline
of the LRI are shown in Figs. 6b,c. The profiles were fitted
with an analytical three-dimensional transport model to the
advective-dispersive-diffusive transport equation. As
shown in Figs. 6b,c, reasonable fits to the measured data
were obtained for
D
*
values varying from 3.0 x 10
-10
m
2
/s
to 8.0 x 10
-10
m
2
/s. The authors concluded that: (a) Br
-
transport through the field-scale liner was controlled by
diffusion, (b) the vertical and horizontal diffusion
coefficients were the same, and (c) CCLs can be
constructed as diffusion controlled barriers that are capable
of mitigating chemical transport from localized leaks or
source zones.


