137
Honour Lectures /
Conférences honorifiques
11
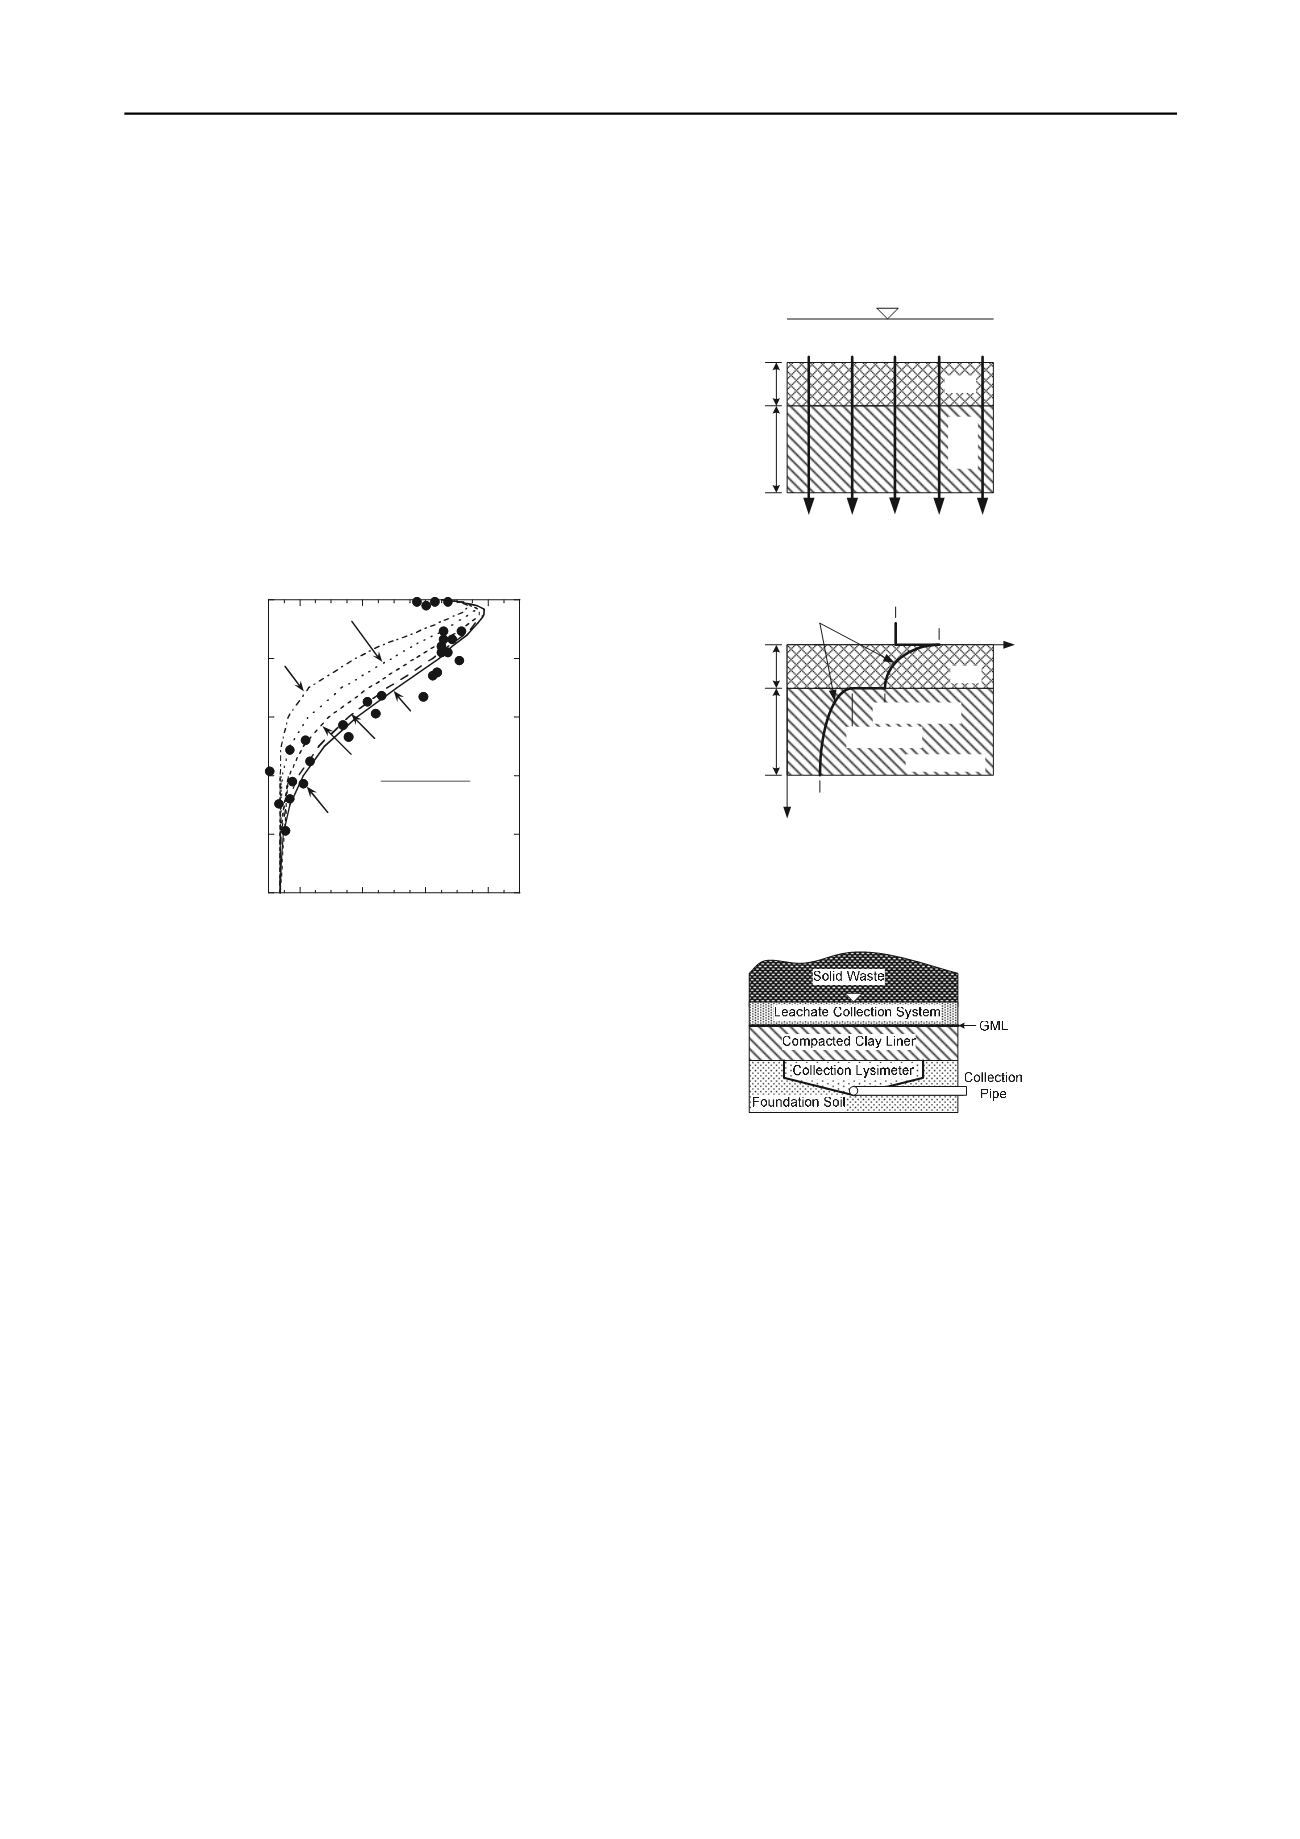
Fig. 11, the resulting concentration profile was consistent
with diffusion dominated transport,
taking into
consideration that reverse or back diffusion had occurred at
the top of the profile due to the placement of water within
the lagoon following removal of the leachate prior to
decommissioning, resulting in a localized reversal in the
concentration gradient. Additional calculations were
performed to evaluate the duration of the effectiveness
(i.e., lifespan) of the GML on the resulting concentration
profiles, with the results indicating that the GML likely
was effective only for an initial period ranging from 0 to 4
yr. Nonetheless, the overall conclusion was that diffusion
was the dominant transport process, and the underlying
groundwater was not impacted due to the 3-m thickness of
the CCL.
0
0.5
1
1.5
2
2.5
200 300 400 500
Depth Below GML (m)
Chloride Concentration (mg/L)
Measured
Lifespan = 6 yr
Lifespan = 0 yr
Lifespan = 4 yr
Lifespan = 8 yr
Lifespan =
10 yr
CCL Parameters:
D
*
= 7 x 10
-10
m
2
/s
k
h
= 2 x 10
-10
m/s
n
e
= 0.45 @ 0.0-0.25 m
= 0.42 @ 0.25-0.5 m
= 0.38 > 0.5 m
Figure 11. Measured and predicted chloride concentration profiles
through the compacted clay portion of a composite liner system
after 14 yr of operation (modified from Rowe et al. 2003, Rowe
2005).
Although there is substantial evidence indicating that
composite liners are effective in terms of waste
containment, i.e., when constructed properly (e.g., Sangam
and Rowe 2001b, Bonaparte et al. 2002, Rowe 2005), there
also is growing evidence the composite liners are not any
more effective against minimizing VOC transport than are
CCLs (e.g., Foose 2002, Foose et al. 2002, Shackelford
2005, Klett 2006). In this case, the VOC first must diffuse
through the overlying GML similar to the situation for the
single GMLs illustrated in Fig. 7. However, once the VOC
has partitioned out from the downgradient side of the
GML, the VOC then must diffuse through the underlying
CCL or GCL, as illustrated in Fig. 12.
For example, Klett (2006) evaluated the measured
concentrations of 11 VOCs existing in 94 lysimeters (e.g.,
Fig. 13) at 34 landfills in Wisconsin lined with either CCLs
or composite liners (some landfills had multiple cells, each
with a lysimeter). The lysimeter data set consisted of 2738
samples analyzed for VOCs. At least one VOC with a
concentration above the limit of detection was detected in
1356 of these samples, and at least one VOC was detected
during one sampling event in each of the 94 lysimeters
evaluated. Toluene was detected most frequently (60% of
the lysimeters) and ten VOCs (toluene, tetrahydrofuran,
dichloromethane, benzene, acetone, chloromethane, xylene
(total),
ethylbenzene,
trichloroethylene,
and 1,1-
dichloroethane) were detected in more than 25 % of the
lysimeters. The most prevalent compounds were aromatic
hydrocarbons (toluene and benzene),
furans
(tetrahydrofuran), and the alkanes (dichloromethane and
1,1- dichloroethane). Based on analysis of variance
(ANOVA) of the measured concentrations, Klett (2006)
concluded that the concentrations for 8 of the 11 VOCs
were statistically no different between clay and composite
lined landfills.
Upgradient Side
Downgradient Side
GML
(0
-
,
t
) =
C
o
C
(0
+
,
t
) =
K
g
C
o
(
L
g
-
,
t
) =
K
g
C
i
(
L
g
+
,
t
) =
C
i
Transient
Profiles
(
L
g
+L
c
,
t
) =
C
e
CCL or GCL
(b)
Containment Liquid (
C
o
)
CCL
or
GCL
GML
Diffusion
(a)
Figure 12. Schematics of diffusion of VOCs through intact
composite liners: (a) conceptual transport; (b) concentration
profiles (modified after Foose et al. 2001, Foose 2002)
Figure 13. Schematic of typical collection lysimeter (underdrain)
beneath a composite liner for a solid waste disposal facility
(modified from Shackelford 2005).
An example of this comparison for dichloromethane
(DCM) is presented in the form of box plots shown in Fig.
14. The center line in each box plot represents the median
of the data, the outer edges of each box represent the
interquartile range (i.e., 25
th
to 75
th
percentiles), and the
outermost lines or "whiskers" represent the 5
th
and 95
th
percentiles. As shown in Fig. 14, the concentrations of
DCM in collection lysimeters beneath composite lined
cells were not any lower than those collected beneath cells
lined only with compacted clay. This similarity in DCM
concentrations is not necessarily surprising, given that
aforementioned lack of resistance to VOC diffusion
offered by most geomembranes. Thus, diffusion of VOCs
through GML-based composite liners remains an issue that
must be addressed when such contaminants are present.


