121
Honour Lectures /
Conférences honorifiques
Proceedings of the 18
th
International Conference on Soil Mechanics and Geotechnical Engineering, Paris 2013
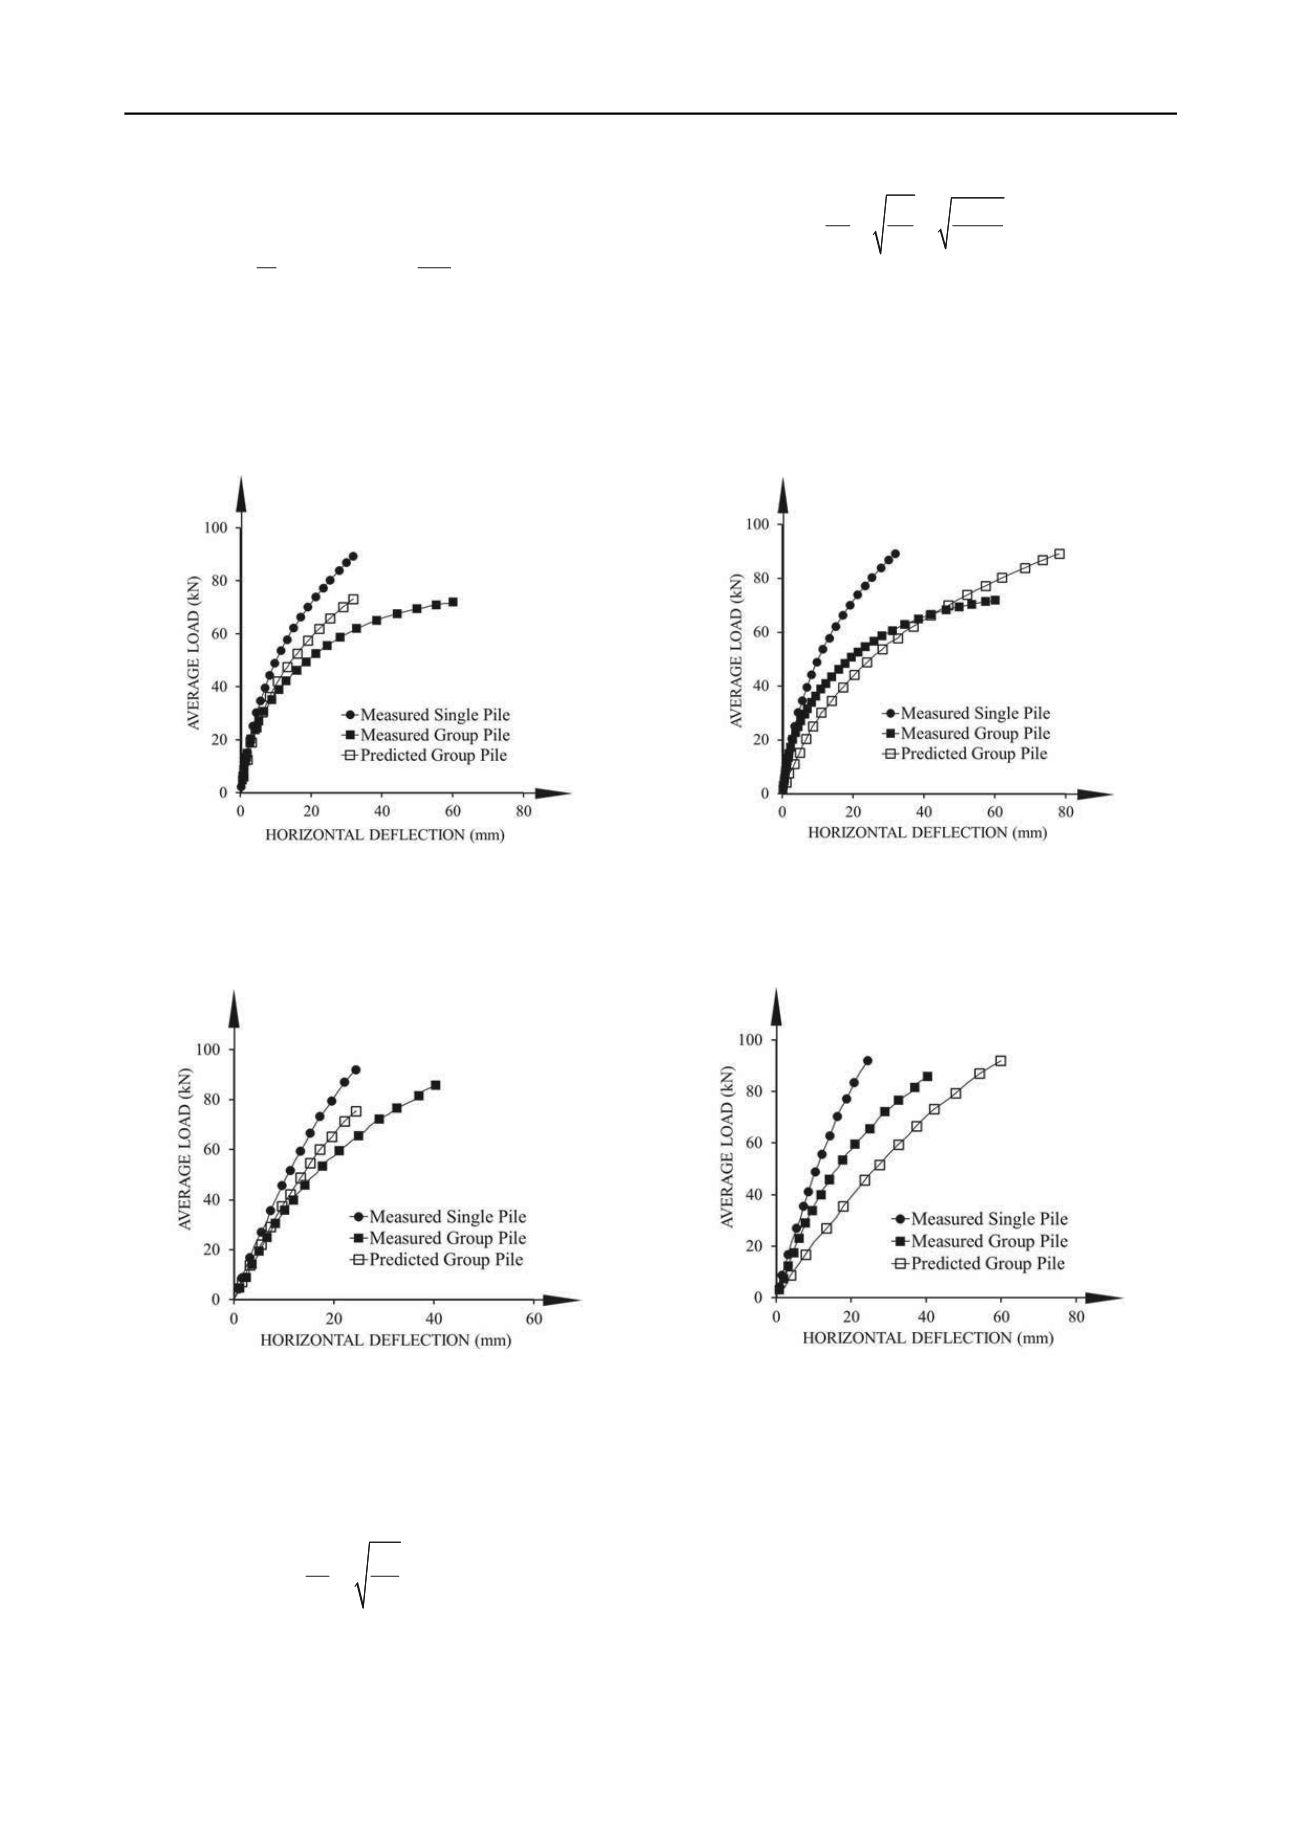
efficiency in Eq. 55 was calculated as follows using Fig. 24 and
25:
0.95
3 0.95 6
9 0.82
1.25
lp
g
lp lp tp
s
s
s
e
H n e n H
H
H
(56)
The predicted curve describing the average horizontal load per
pile in the group versus the group horizontal displacement was
obtained by using the horizontal load versus horizontal
displacement curve for the single pile and multiplying the single
pile load by 0.82 for any given movement. The curve predicted
using this approach is shown on Fig. 26 (clay) and 27 (sand)
along with the measured curves.
Figure 26. Predicted by Cox efficiency factor method and
measured load-displacement curve for Brown-Reese group
test in clay (1985)
Figure 27. Predicted by Cox efficiency factor method and
measured load-displacement curve for Morrison-Reese group
test in sand (1986)
O’Neill (1983) suggested that the best and simplest
efficiency factor to use for the settlement of a group of
vertically loaded piles was:
g
g
s
s
s
B
s
B
(57)
Where s
s
is the settlement of the single pile under the working
load Q, s
g
the settlement of the group under nQ, n the number of
piles in the group, B
g
the width of the group and B
s
the width of
the single pile. This efficiency factor for the Brown and Reese
pile group was (Fig. 23)
1.91 2.65
0.273
g
g
s
s
y
B
y
B
(58)
The curve linking the average load per pile in the group versus
group displacement was obtained by using the load versus
displacement curve for the single pile and, for any given
horizontal movement, multiplying the single pile movement by
2.65. That predicted curve is shown on Fig. 28 and 29 along
with the curve measured by Brown and Reese for their test in
clay (1985) and Morrison and Reese for their test in sand (1986)
respectively. The measured single pile curve is also shown for
reference.
Figure 28. Predicted by O’Neill efficiency factor method
and measured load-displacement curve for Brown-Reese
group test in clay (1985)
Figure 29. Predicted by O’Neill efficiency factor method
and measured load-displacement curve for Morrison-Reese
group test in sand (1986)
11 HORIZONTAL IMPACT LOADING FROM VEHICLE
In the case of road side safety, embassy defense against terrorist
trucks, ship berthing, piles are impacted horizontally. To predict
the behavior of piles subjected to horizontal impact, it is
possible to use 4D programs (x, y, z, t) such as LSDYNA
(2006). This is expensive and time consuming. The problem can
be simplified by using a P-y curve approach generalized to
include the effect of time. In this case the governing differential
equation is


