111
Honour Lectures /
Conférences honorifiques
Proceedings of the 18
th
International Conference on Soil Mechanics and Geotechnical Engineering, Paris 2013
Consider the case where the ratio E
+
/E
-
= 10, ν
1
= ν
3
= 0.33,
then ν
2
equal to 0.033. Then Eq.23 and Eq. 28 give respectively:
0.309
o
ro
o
uE
r
(29)
0.752
o
ro
o
o
uE
r
(30)
Therefore,
E
+
= 2.43E
o
(31)
This can be repeated for different values of E
+
/E
-
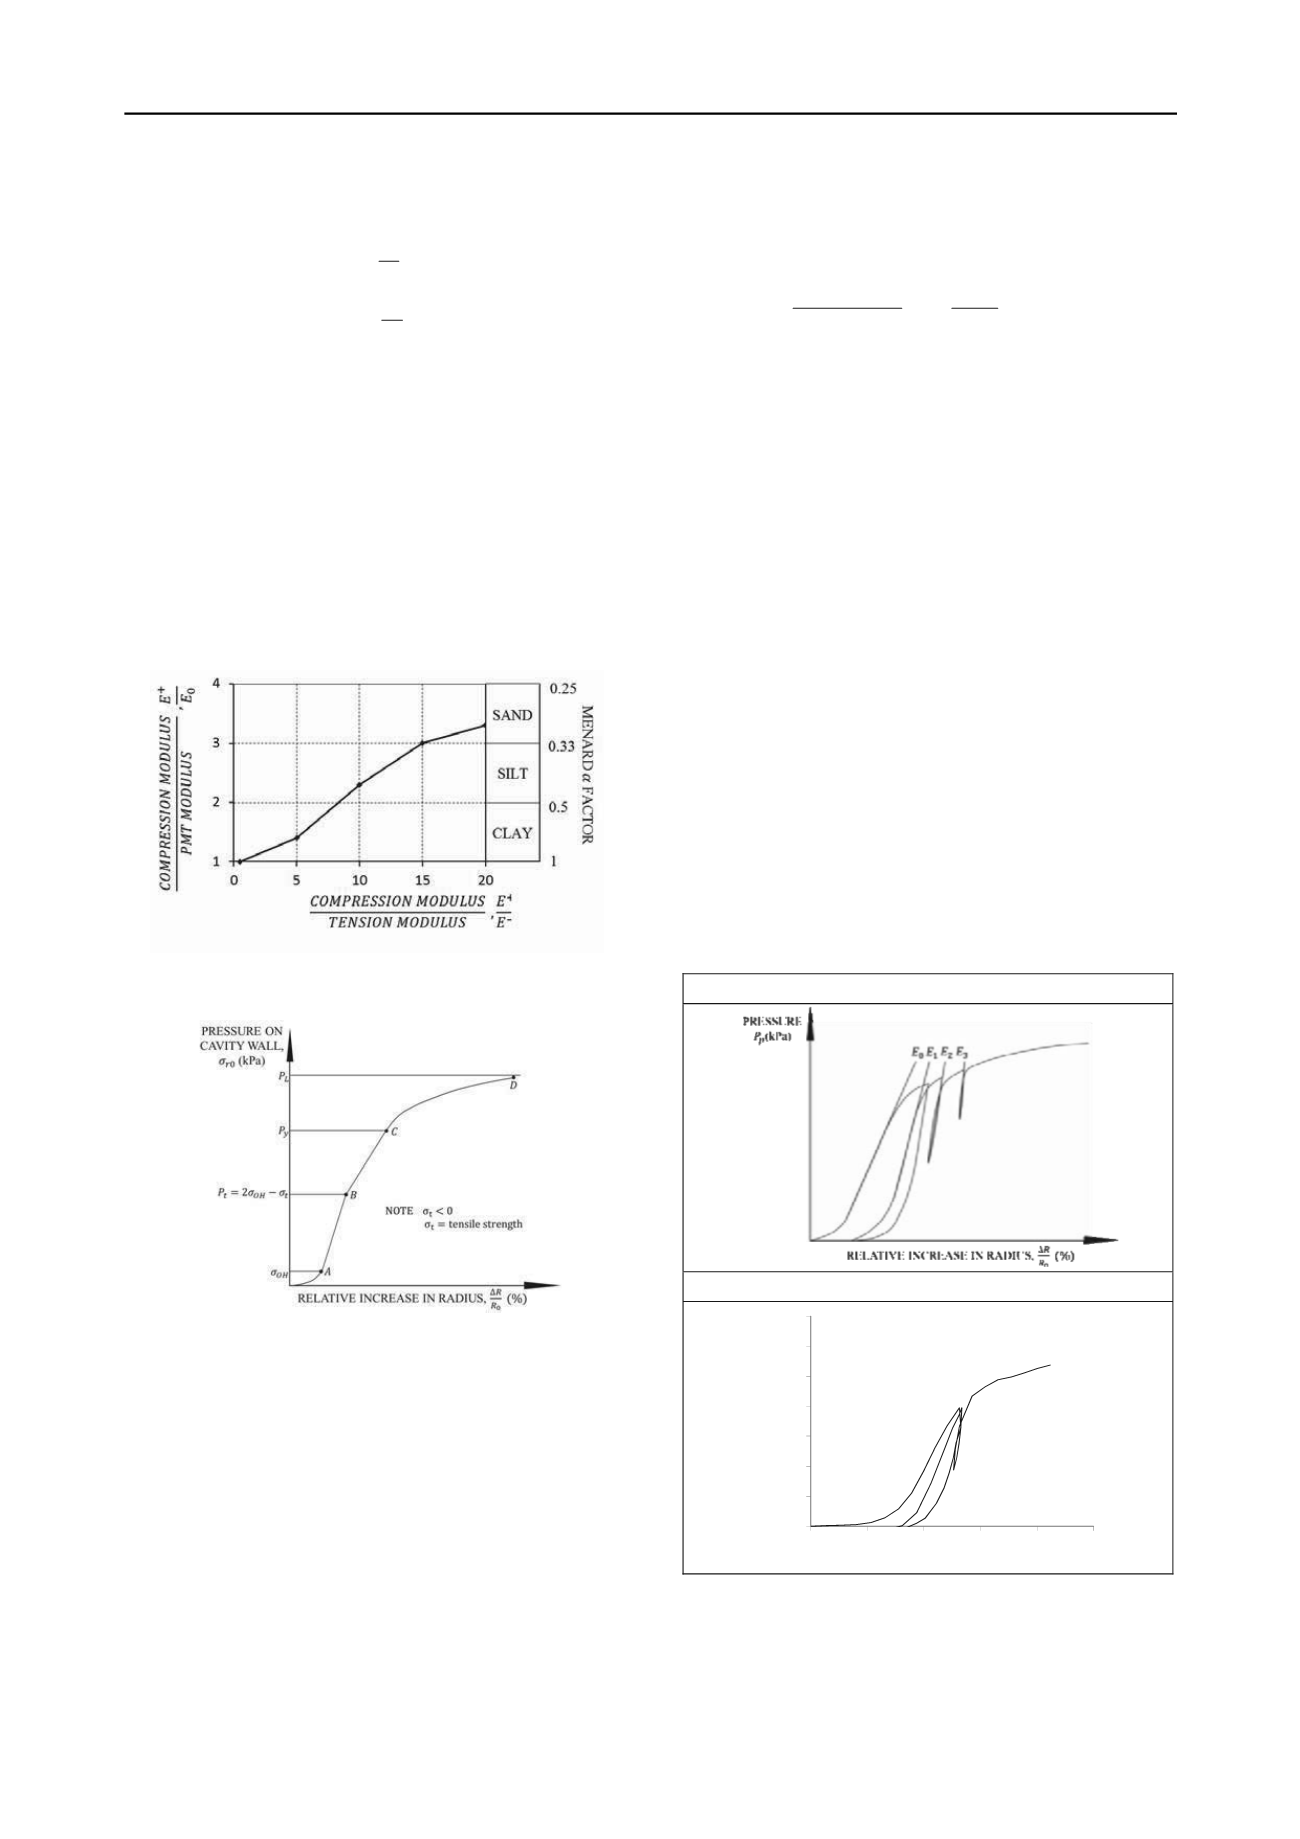
to obtain Fig.
6. The inverse of the modulus ratio is consistent with the values
recommended by Menard for the α values in settlement analysis
as shown in Fig.6. This observation about the tension in the
hoop direction also impacts PMT tests in hard soils and rock
which are sound enough to exhibit significant tensile strength.
In this case, the PMT curve shows a break in the expansion
curve (Fig. 7) at a pressure p where the hard soil or rock breaks
in tension. This pressure is such that (Briaud, 1992):
2
t
p
oh
(32)
Where σ
t
is the soil tensile strength and σ
oh
is the horizontal
stress at rest before the PMT is inserted.
Figure 6. Correction of PMT modulus for low tension soils
Figure 7. Tensile strength from PMT test
7.2 PMT first load modulus
The PMT first load modulus E
o
also called the Menard modulus
is obtained from the initial straight line part of the PMT curve.
This straight line exists over a range of relative increase in
cavity radius which varies from one soil to another but is
typically in the range of 2 to 6 % relative increase in cavity
radius. At two sites in Texas, one in stiff clay the other in dense
sand, the average range of 15 PMT tests was 3.47% for the clay
site and 3.59% for the sand site. This refers to the value of
ΔR/R
o
at the cavity wall. The average radial strain in the soil
mass involved in the response to the cylindrical cavity
expansion is much smaller and averages 0.316 ΔR/R
o
as shown
in the following. The hoop strain ε
θ
and the increase in radial
stress Δσ
r
decrease away from the wall of the cavity at a rate of
1/R
2
where R is the radial distance into the soil mass (Baguelin
et al., 1978). If the radius of influence of the pressuremeter
expansion is defined as the radius at which ε
θ
and Δσ
r
are 1/10
th
of the value at the cavity wall, that radius of influence is 10
0.5
R
o
= 3.16R
o
. Within this radius of influence, the average strain ε
θ
can be calculated as follows
2
3.16
2
1
0.316
3.16
o
o
R o o
av
o
R
o
o
R dR
R R
R
(33)
where ε
θav
is the average hoop strain within the radius of
influence of the pressuremeter test, ε
θo
is the hoop strain at the
wall of the cavity, R
o
is the initial radius of the cavity, and R is
the radial distance in the soil. The modulus was mentioned as
being associated with a strain level at the cavity wall ε
θo
typically in the range of 2 to 6%; this means that the average
strain ε
θav
will be 0.6 to 2%. For the two Texas sites mentioned
above, the average strain would be close to 1% (3.53% x 0.316).
Note that this range of strain is consistent with the strain level
associated with foundation engineering but is much higher than
the range of strain associated with pavement design or
earthquake shaking where a very low strain modulus is used.
The fact that the small strain modulus is absent from the
beginning of the PMT curve and that the strain range is between
0.6 to 2%, is created in part by the recompression of the soil
which was decompressed horizontally by the drilling process.
This recompression makes the small strain part of the stress
strain curve disappear as shown in the PMT test on Fig. 8. In
this test, an unload-reload loop was performed by decreasing the
pressure to zero and increasing it again to simulate a first
expansion curve. Then a second unload-reload loop was
performed over a much smaller pressure range. This test shows
that the recompression modulus varies tremendously depending
on the extent of the unloading. This test also shows that the low
strain information is lost in the decompression and
recompression loading process. Can we find a way to recreate
the early part of the PMT curve from the information gathered
during the test.
CONCEPT
ACTUAL TEST
0
200
400
600
800
1000
1200
1400
0.00 0.04 0.08 0.12 0.16 0.20
P (kPa)
dR/R0
Figure 8. PMT stress strain curve with unload reload loops
7.3 PMT modulus at small strain
A soil modulus depends on several factors (Briaud, 2013) one
of which is the strain level. The PMT curve is a stress strain
curve where the stress is the radial stress σ
r
(measured pressure


