114
Proceedings of the 18
th
International Conference on Soil Mechanics and Geotechnical Engineering, Paris 2013
Proceedings of the 18
th
International Conference on Soil Mechanics and Geotechnical Engineering, Paris 2013
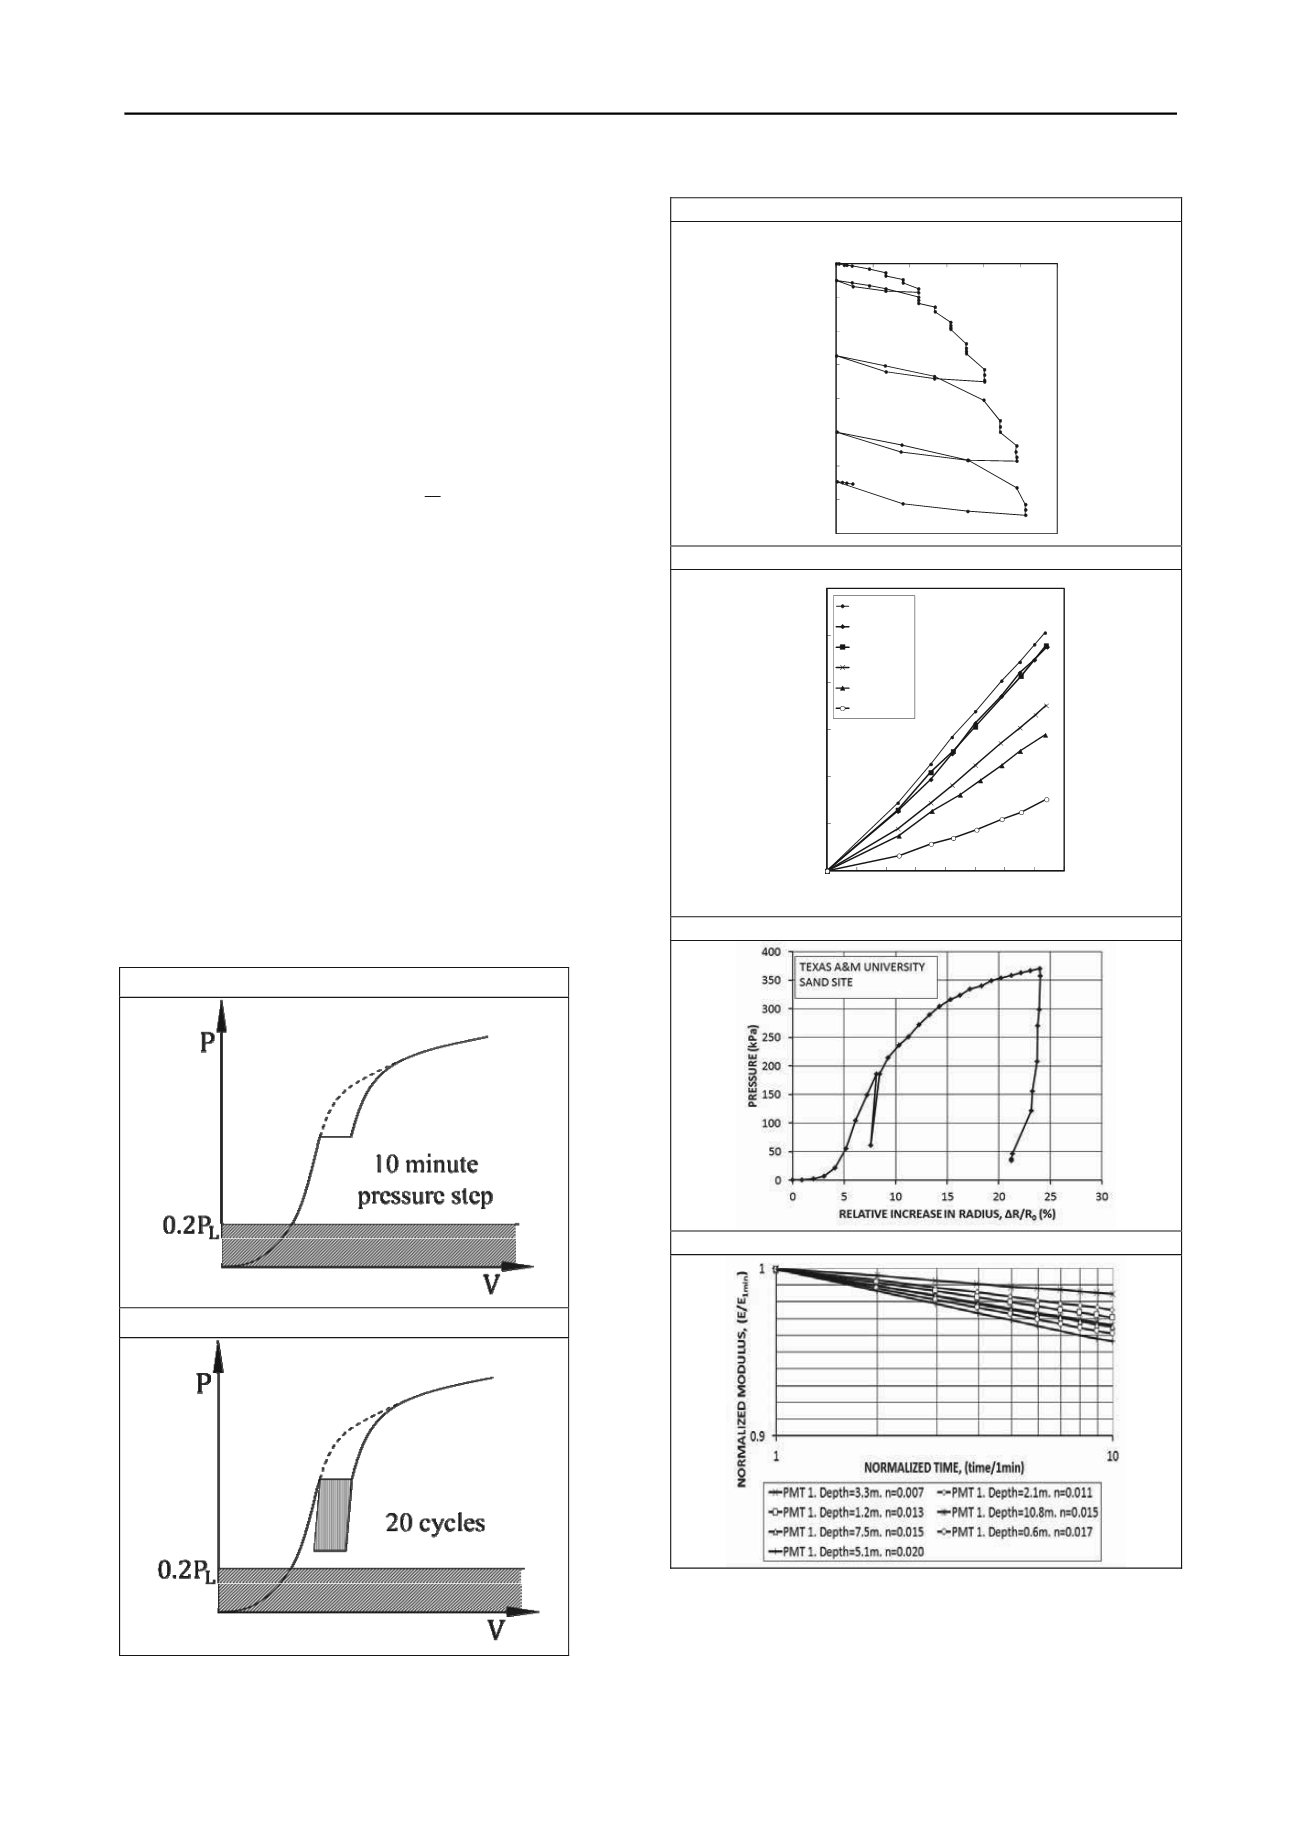
7.4 PMT modulus long term creep, and cyclic loading
It is relatively easy to maintain the pressure constant during a
PMT test while recording the increase in radius of the cavity
(Fig. 12). A pressure holding step of 10 minutes is not very time
consuming and can lead to very valuable information if the
structure will be subjected to long term loading (e.g.: building,
retaining wall). The pressure held for 10 minutes should be
higher than 0.2p
L
because below that threshold the influence of
the decompression-recompression effect and the disturbance
effect is more pronounced (Briaud, 1992). The evolution of the
secant modulus E
t
during the pressure holding test is well
described by the following model:
o
n
t
t
o
t
E E
t
(37)
Where t is the time after the start of the pressure holding step, t
o
is a reference time after the start of the pressure holding step
usually taken as 1 minute, E
t
and E
to
are the secant modulus
corresponding to t and t
o
respectively, and n is the creep
exponent. The value of n is obtained as the slope of the plot of
log E
t
/E
to
vs. log t/t
o
. The creep exponent n increases with the
stress applied over strength ratio and depends on the soil type
and stress history. It has been found in the range of 0.01 to 0.03
for sands and in the rnage of 0.03 to 0.08 for clays (Briaud,
1992). For clays, the lower values are for overconsolidated
clays while the higher values are for very soft clays.
Measurements on large scale spread footings on an unsaturated
silty sand (Briaud, Gibbens, 1999) demonstrated that the power
law model works very well (Fig. 13) because the log settlement
vs. log time curve was remarkably linear. These experiments
also indicated that n increases with the load level but is
significantly reduced by unload reload cycles. PMT tests with
creep steps were performed next to the footings (Fig. 13c and
13d); the parallel between the footing and the PMT is striking.
a. CREEP TEST
b. CYCLIC TEST
Figure 12. Creep and cyclic PMT test
a. FOOTING LOAD-SETTLEMENT CURVE
-160
-140
-120
-100
-80
-60
-40
-20
0
0 2 4 6 8 10 12
SETTLEMENT (mm)
LOAD (MN)
b. FOOTING SETTLEMENT VS TIME CURVE
0.00
0.01
0.02
0.03
0.04
0.05
0.06
0.0 0.2 0.4 0.6 0.8 1.0 1.2 1.4 1.6
LOG DISPLACEMENT LOG
10
(S/S
1
)
LOG TIME, LOG
10
(t/t
1
)
6.23 MN
7.12 MN
8.01 MN
8.9 MN
9.79 MN
10.24 MN
c. PMT STRESS VS STRAIN CURVE
d. PMT MODULUS VS TIME CURVE
Figure 13. Creep response of a 3m by 3m spread footing and a
PMT test (Briaud, Gibbens, 1999, Jeanjean, 1995).
Similarly, one can conduct cyclic loading during the PMT
test. A series of 10 cycles is not very time consuming and can
lead to very valuable information if the structure will be


