115
Honour Lectures /
Conférences honorifiques
Proceedings of the 18
th
International Conference on Soil Mechanics and Geotechnical Engineering, Paris 2013
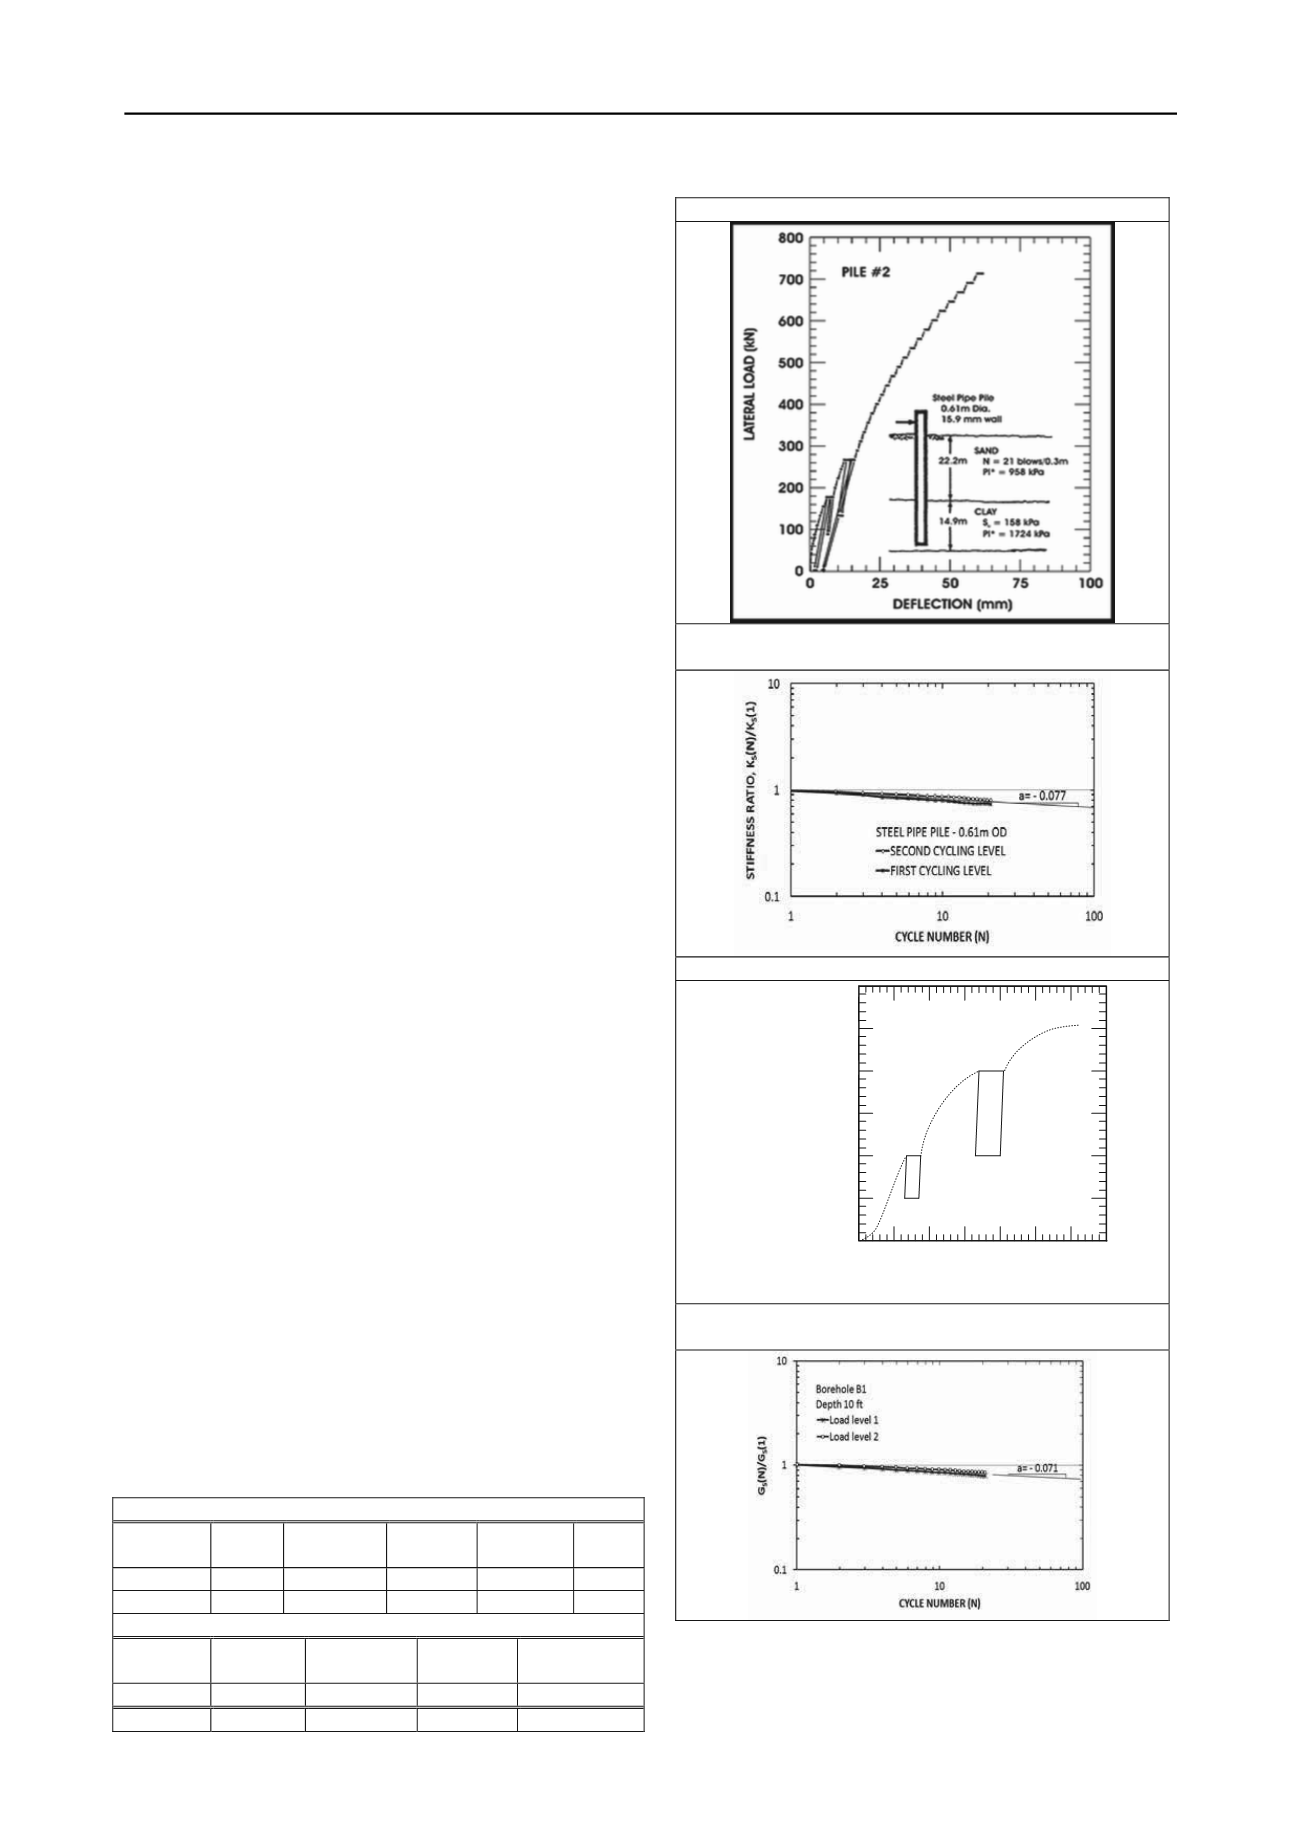
subjected to significant repeated loading (e.g.: large wave
loading). The evolution of the secant modulus E
N
to the top of
cycle N is well described by the following model
1
m
N
E E N
(38)
Where N is the number of cycle using number 1 as the first
loading cycle, E
N
the secant modulus to the top of the N
th
cycle,
E
1
the secant modulus to the top of the first cycle (first time that
the pressure is decreased), and m is the cyclic exponent. The
value of m is obtained as the slope of the plot of log E
N
/E
1
vs.
log N. Fig. 14 shows a parallel example of a pile subjected to
cyclic horizontal loading and a cyclic PMT test. As can be seen
the power law model of Eq.38 describes the evolution of the
deformation with the number of cycles (straight line on log-log
scales) very well and the parallel between the pile and the PMT
is striking.
7.5 PMT unload-reload modulus
The unload reload modulus E
r
is obtained by performing an
unload reload loop during the PMT test. The main problem with
E
r
is that, unlike E
o
, it is not precisely defined. Indeed it
depends on the strain amplitude over which the loop is
performed and to a lesser extent on the stress level at which the
loop is performed. As such, E
r
varies widely from one user to
another and cannot be relied upon for standard calculations
unless the strain amplitude and stress level have been selected to
match the problem at hand. In my practice, I perform an unload
reload loop at the end of the linear phase and unload until the
pressure has reached one half of the peak pressure. This has the
advantage of being consistent but does not necessarily
correspond to a consistent strain amplitude from one test to the
next. I would strongly discourage the use of the reload modulus
because it is not a standard modulus. Instead I would
recommend the use of a hyperbolic extension of the PMT curve
to find the modulus at the right strain level.
7.6 The yield pressure p
y
.
The yield pressure p
y
is found at the end of the straight line
corresponding to the PMT modulus. Up to p
y
, the amount of
creep is reasonably small but becomes much larger beyond that.
In geotechnical engineering it is always desirable to apply
pressures on the soil below the value of p
y
. Typically p
y
is 0.5
p
L
for clays and 0.33 p
L
for sands. Therefore, at working loads,
it is advisable to keep the pressure under foundations at most
equal to 0.5 p
L
in clays and 0.33 p
L
in sands to limit creep
deformations.
7.7 Correlations between PMT parameters and other soil
parameters
Correlations based on 426 PMT tests performed at 36 sites in
sand and 44 sites in clay along with other measured soil
parameters were presented by Briaud (1992). These correlations
exhibit significant scatter and should be used with caution.
Nevertheless they are very useful in preliminary calculations
and for estimate purposes. Table 3 gives the range of expected
PMT limit pressure and modulus in various soils while Tables 4
and 5 give the correlations.
Table 3. Expected values of E
o
and P
L
in soils
CLAY
Soil
strength
Soft
Medium
Stiff
Very Stiff
Hard
p
*
L
(kPa)
0–200
200–400
400–800
800-1600
>1600
E
0
(MPa)
0 – 2.5
2.5 - 5.0
5.0 - 12
12 - 25
> 25
SAND
Soil
strength
Loose
Compact
Dense
Very Dense
p
*
L
(kPa)
0 – 500
500 - 1500
1500-2500
> 2500
E
0
(MPa)
0 – 3.5
3.5 - 12
12 – 22.5
> 22.5
a. PILE LOAD-DISPLACEMENT CURVE
b. PILE STIFFNESS VS NUMBER OF CYCLES
CURVE
c. PMT STRESS STRAIN CURVE
d. PMT MODULUS VS NUMBER OF CYCLES
CURVE
Figure 14. Cyclic response of a laterally loaded pile A and a
PMT test (Little, Briaud, 1988).


