2104
Proceedings of the 18
th
International Conference on Soil Mechanics and Geotechnical Engineering, Paris 2013
1000
1000
400
200
sheet pile wall
drainage
water tank
hole
supply of water
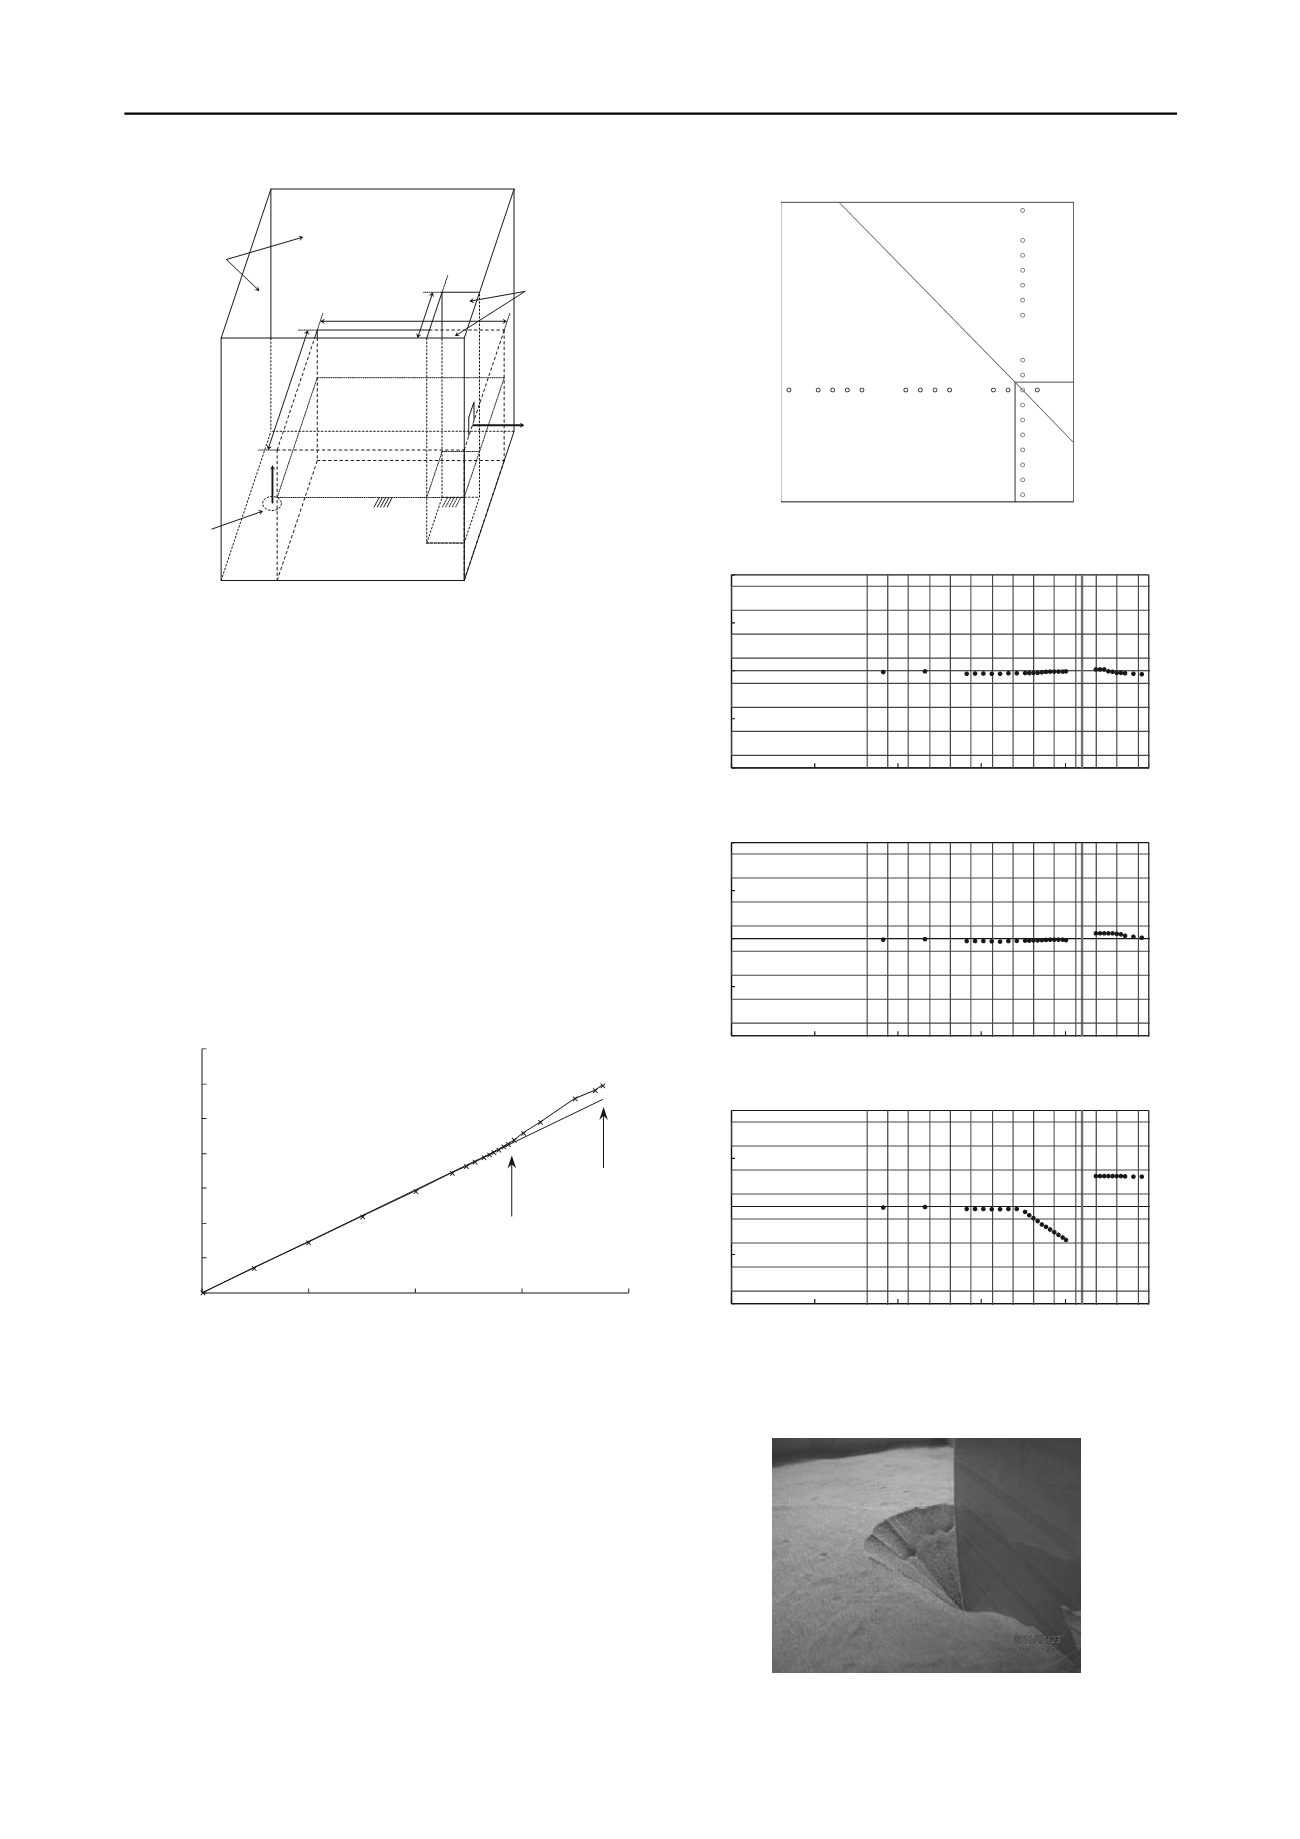
Figure 1. Schematic sketch showing test apparatus
3 EXPERIMENTAL RESULTS
3.1
H-Q
15
curve and change in shapes of soil surface
Figure 2 shows the
H-Q
15
curve for test E0317, where
Q
15
is the
discharge at 15 degrees Centigrade. It is observed from Figure 2
that
Q
15
increases linearly with increasing
H
until a certain
value
H
d
.
H
d
value is referred to as the hydraulic head difference
at which the
H-Q
15
curve diverts from linearity. As stated
below, at almost the same point as
H
d
, the soil surface begins to
settle on the upstream side and rise on the downstream side.
This is because, just at this point, the soil loosens on the
downstream side, the void space enlarges, permeability of the
soil grows larger, and discharge increases non-linearly with
H
.
As
H
increases beyond
H
d
,
Q
15
becomes larger with increasing
H
more steeply than before, and the ground finally collapses at
he hydraulic head difference at failure
H
f
.
t
0.0
10.0
20.0
30.0
40.0
50.0
60.0
70.0
0.0
10.0
20.0
30.0
40.0
Q
15
(
×
10
-6
m
3
/s)
H
(
×
10
-2
m)
Figure 2.
H
-
Q
15
curves for test E0317
The heights of the soil surface are measured at several
chosen points along the measurement line shown in Figure 3.
The measurement line is a bisector of the right angle of the
inside corner of the rectangular diaphragm wall. Figures 4 (a)-
(c) show the changes in shape of the surface of the sand model
along the surface height measurement line with increase in
H
,
from
H
=4.81cm at the first step to
H
=36.78cm at one step
before failure. The model sand is in a stable state at early steps
of
H
(Figure 4(a)). When
H
increases beyond a certain value
H
y
,
the model sand changes in shape near the sheet pile wall. The
surface of the soil in the vicinity of the sheet pile wall subsides
on the upstream side and rises on the downstream side (Figure
4(b)). The value of
H
y
is referred to as the hydraulic head
difference at onset of deformation. It was found from a series of
Figure 3. Measurement line of the height of soil surface
0. 2
0. 3
0. 4
0. 5
0. 6
0. 0
0. 2
0. 4
0. 6
0. 8
1. 0
(a) At the early step of
H
(
H
=4.81cm)
0. 2
0. 3
0. 4
0. 5
0. 6
0. 0
0. 2
0. 4
0. 6
0. 8
1. 0
(b) At the
H
value just beyond
H
y
(
H
=30.06cm)
0. 2
0. 3
0. 4
0. 5
0. 6
0. 0
0. 2
0. 4
0. 6
0. 8
1. 0
H
f
H
d
(c) At the one step before failure (
H
=36.78cm)
Figure 4. Changes in shape of surface of sand model along the surface
height measurement line with increase in
H
Figure 5. A close-up photo of the upstream inverse conical shape at
H
=36.78cm (E0317)


