2105
Technical Committee 207 /
Comité technique 207
tests that the experimental results lead to the interesting
conclusion
H
y
=
H
d
.
Subsidence of the upstream soil surface and rising of the
downstream soil surface proceed with steps of increasing
H
.
The upstream soil surface is an inverse conical shape centered at
the outer corner of the rectangular diaphragm wall. A close-up
photo of the upstream inverse conical shape is shown in Figure
5 at
H
=36.78cm (E0317). The rise in the downstream soil
surface occurs uniformly within a certain width from the sheet
pile wall. As
H
increases and approaches
H
f
, the upstream
subsidence shows a clear inverse conical shape, and sand
particles are observed to roll down the slope of the upstream
soil surface (Figure 4 (c)).
4 STABILITY ANALYSES –RESULTS AND
DISCUSSIONS–
4.1
Prismatic failure concept 3D
The Prismatic failure concept 3D presented by Tanaka et al.
(2012) is used for estimating the stability against seepage failure
of soil. In the Prismatic failure concept 3D, we assume that the
body of soil lifted by seepage water has the shape of a prism
with a certain height and width adjoining the sheet pile wall.
The rise of the prism is resisted by the submerged weight,
W’
,
and frictions
F
RL
and
F
RCR
on the left and right sides and
F
RF
and
F
RCB
, on the front and back sides. The safety factor
F
s
with
respect to the rise of the prism, which is subjected to the excess
pore water pressure on its base,
U
e
, is given as:
e
RCB
RF
RCR
RL
s
U
F F F FW
F
'
(1)
For the hydraulic head difference
H
between up- and
downstream sides, safety factors,
F
s
, are calculated for all of the
prisms within a cofferdam. The safety factor
F
s
takes the
minimum
F
s
min
for a certain prism among all of the prisms. The
calculation is iterated for another hydraulic head difference,
H
,
until the condition whereby
F
s
min
becomes nearly equal to 1.0 is
found.
H
=
H
c
at which the condition
F
s
min
=1.0 is applied is
defined as the critical hydraulic head difference. The prism with
a value of
F
s
min
=1.0 among all of the prisms for
H
=
H
c
is
defined as the critical prism. We could say that the critical
prism is separated from the underlying soil at its base when
H
exceeds
H
c
. Safety factors using the Prismatic failure concept
3D when considering frictions are discussed below.
4.2
Relationship between hydraulic head differences H
c
(by
theory) and H
y
(by experiment)
For Lake Biwa sand 3 of
D
r
=50%, the theoretical hydraulic
head difference by the Prismatic failure concept 3D,
H
PF
[Tanaka et al. 2012] is analyzed taking the anisotropy of the test
sand to be
k
xx
/k
zz
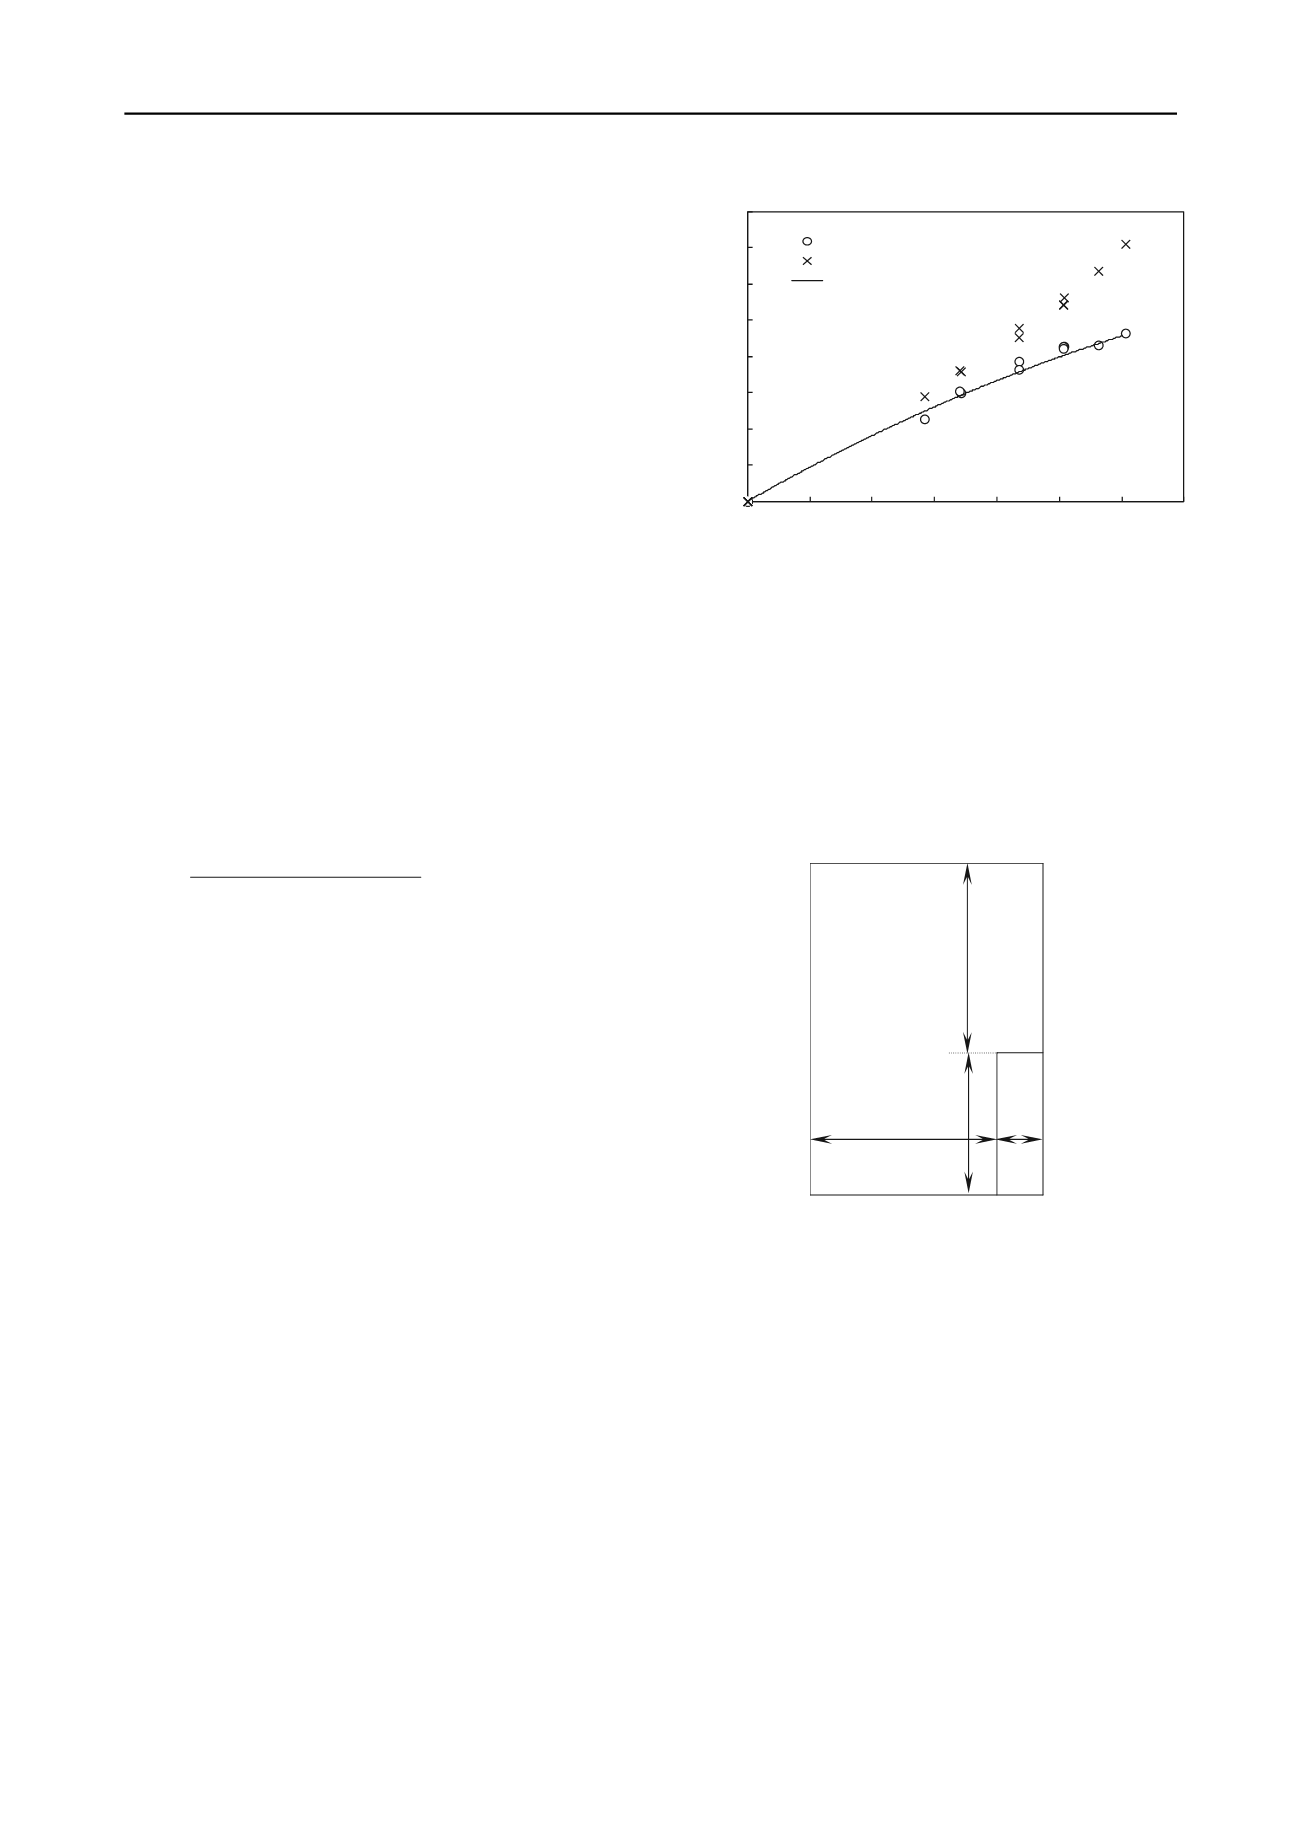
=1.20 [Tanaka et al. 2011]. Figure 6 shows the
relationship between
D/T
and
H
c
w
/T
’
for a no-excavation
model. The experimental results are also plotted in Figure 6. It
is observed from Figure 6 that the calculated critical hydraulic
head differences
H
PF
are very close to the measured
H
y
. The
Prismatic failure concept 3D thus proved to be a useful method
for calculating critical hydraulic head difference at the onset of
deformation of soil within a cofferdam. The same is true of the
excavation model.
4.3
Effects of surface shape of a cofferdam on H
c
Let us consider a cofferdam whose surface shape is rectangular
with the shorter length at
B
and longer length at
L
(see Figure
7). Four cases of
B
:
L
=1:1, 1:2, 1:3 and 1:4 are analyzed for
constant values of
B
=0.2m and
W
=0.8m. Figure 8 shows the
relationship between
D/T
and
H
c
w
/T
’
. It follows from Figure 8
that:
0.0
0.2
0.4
0.6
0.8
1.0
1.2
1.4
1.6
0
0.1
0.2
0.3
0.4
0.5
0.6
0.7
H
c
w
/T
'
D/T
Hy
Hf
Theory by PFC
Figure 6. Relationship between
D/T
and
H
c
w
/T
’
for no excavation
model
(1)
H
c
gives the lowest value in the case of 1:1.
(2) For the same value of penetration ratio of sheet piles,
D/T
,
the critical hydraulic head differences,
H
c
, are given as follows
in order of increasing magnitude: 1:1 < 1:2 < 1:3 < 1:4.
(3) For the same value of a short length, the more the longer
length increases, the smaller the effect of the longer length on
H
c
becomes.
H
c
in the case of 1:3 almost equals the
H
c
in the
case of 1:4 for the same value of
D/T
.
(4) For a small value of
D/T
, all of the
H
c
values are nearly
equal in cases of 1:1, 1:2, 1:3, and 1:4.
W
L
W
B
Figure 7. Plane shape of a cofferdam
5 AXISYMMETRIC MODELING OF THREE-
DIMENTIONAL SEEPAGE FLOW
In the experiment, one quarter of the three dimensional region is
examined as stated earlier. The surface shape of the cofferdam
is rectangular with the shorter length at 1 and longer length at 2.
Considering an inscribed circle in the shorter side of the
rectangle as shown in Figure 9, an axisymmetric seepage flow
through the soil is used to model such a three-dimensional flow.
Let us consider the three dimensional and approximate
axisymmetric conditions:
T
=40cm,
D
=20cm and
R
=20cm for
the non-excavation sand models, where
R
is the radius of the
circular wall in the axisymmetric condition. Figure 10 shows
the relationship between the penetration ratio of sheet piles
D/T
and the non-dimensional value of
H
c
,
H
c
w
/T
’
. It is found from
Figure 10 that the three dimensional seepage failure phenomena
are well approximated using axisymmetric seepage failure. For
further details, the following points may be made:
(1)
D/T
0.40
H
c
values are larger in the AXS flow than in the
3D flow; in particular the approximate accuracy with respect to
H
c
, (
H
c
AXS
H
c
3D
)
/H
c
3D
, is about +17% for
D/T
= 0.27. This


