3505
Technical Committee 103 /
Comité technique 103
sb
w
p
rm
w
p
1
+
global
wn
p
( )
( )
T
T
T
d
d
d
Ω
Ω
Ω
′
=
Ω
′
=
Ω
=
Ω
∫
∫
∫
D
σ
D
σ
D
sb
rm
ca
sb
sb
sb
sb
rm
rm rm
rm
ca
ca
ca
K B
B
K B
B
K B B
(12)
The
sb
r
term in (4) represents the contribution of the
radiation boundaries to the discretized governing equations,
while
rm
c
and
ca
c
terms, appearing in (5) and (6), respectively,
represents the contribution of the rubble mound - caisson
contact to the discretized governing equations.
The proper choice of the element type in order to discretize
the computational domain is of paramount importance as some
elements introduce errors leading to unrealistic limit loads and
spurious failure elements (Sloan et al 1982). Under Babuska-
Brezzi robustness condition, keeping in mind the need of a
C
0
interpolation for each field variable, in the present paper a
mixed isoparametric lagrangian triangular element has been
used, with 6 nodes quadratic interpolation for any skeleton
displacement,
sb
u
,
rm
u
and
ca
u
, and 3 node linear interpolation
for pore water pressure interpolation, , .
Temporal
discretization
of
the
displacements
[
]
T
,
,
=
global
sb
rm
ca
u
u u u
is performed by the Generalized
Newmark
GN22
scheme while the excess pore pressure of the
sea bed and rubble mound
[
]
T
,
global
sb
rm
w
w
w
=
p
p p
are discretized
by the
GN11
scheme, leading to the following difference
equation
1
1
1
2
2
1
2
1
1
2
2
global
global
global
n
n
n
global
global
global
global
n
n
n
n
global
global
global
global
global
n
n
n
n
n
t
t
t
t
t
β
β
+
+
+
= + ∆
= + ∆ ⋅
+ ⋅ ∆ ⋅ ∆
= + ∆ ⋅
+ ∆ ⋅ ∆ + ∆ ⋅ ⋅ ∆
u u
u
u u
u
u
u u
u
u
u
(13)
1
1
1
global
global
global
wn
wn
wn
global
global
global
global
wn
wn
wn
wn
t
t
β
+
+
= + ∆
= + ∆ ⋅
+ ∆ ⋅ ⋅ ∆
p
p
p
p
p
p
p
(14)
After the incorporation of difference equation (13) and (14) in
(1)-(3) a non linear algebraic system is obtained where the
unknown values are
,
,
,
,
sb
sb
rm rm
ca
n
wn
n
wn
n
∆ ∆ ∆ ∆ ∆
u p u p u
. The Newton-
Raphson scheme is used to solved the non linear algebraic in
each time step, obtaining the values of the displacements
1
global
n
+
u
and pore water pressure at time
t
n+1
by the
difference
equations (13) and(14).
4 VALIDATION
The large scale model test conducted in 2004 by Kudella and
Oumeraci (Kudella et al 2006) in the Large Wave Flume
(GWK) of Hannover is numerically reproduced under the scope
of the soil-water-structure interaction model proposed in the
present paper.
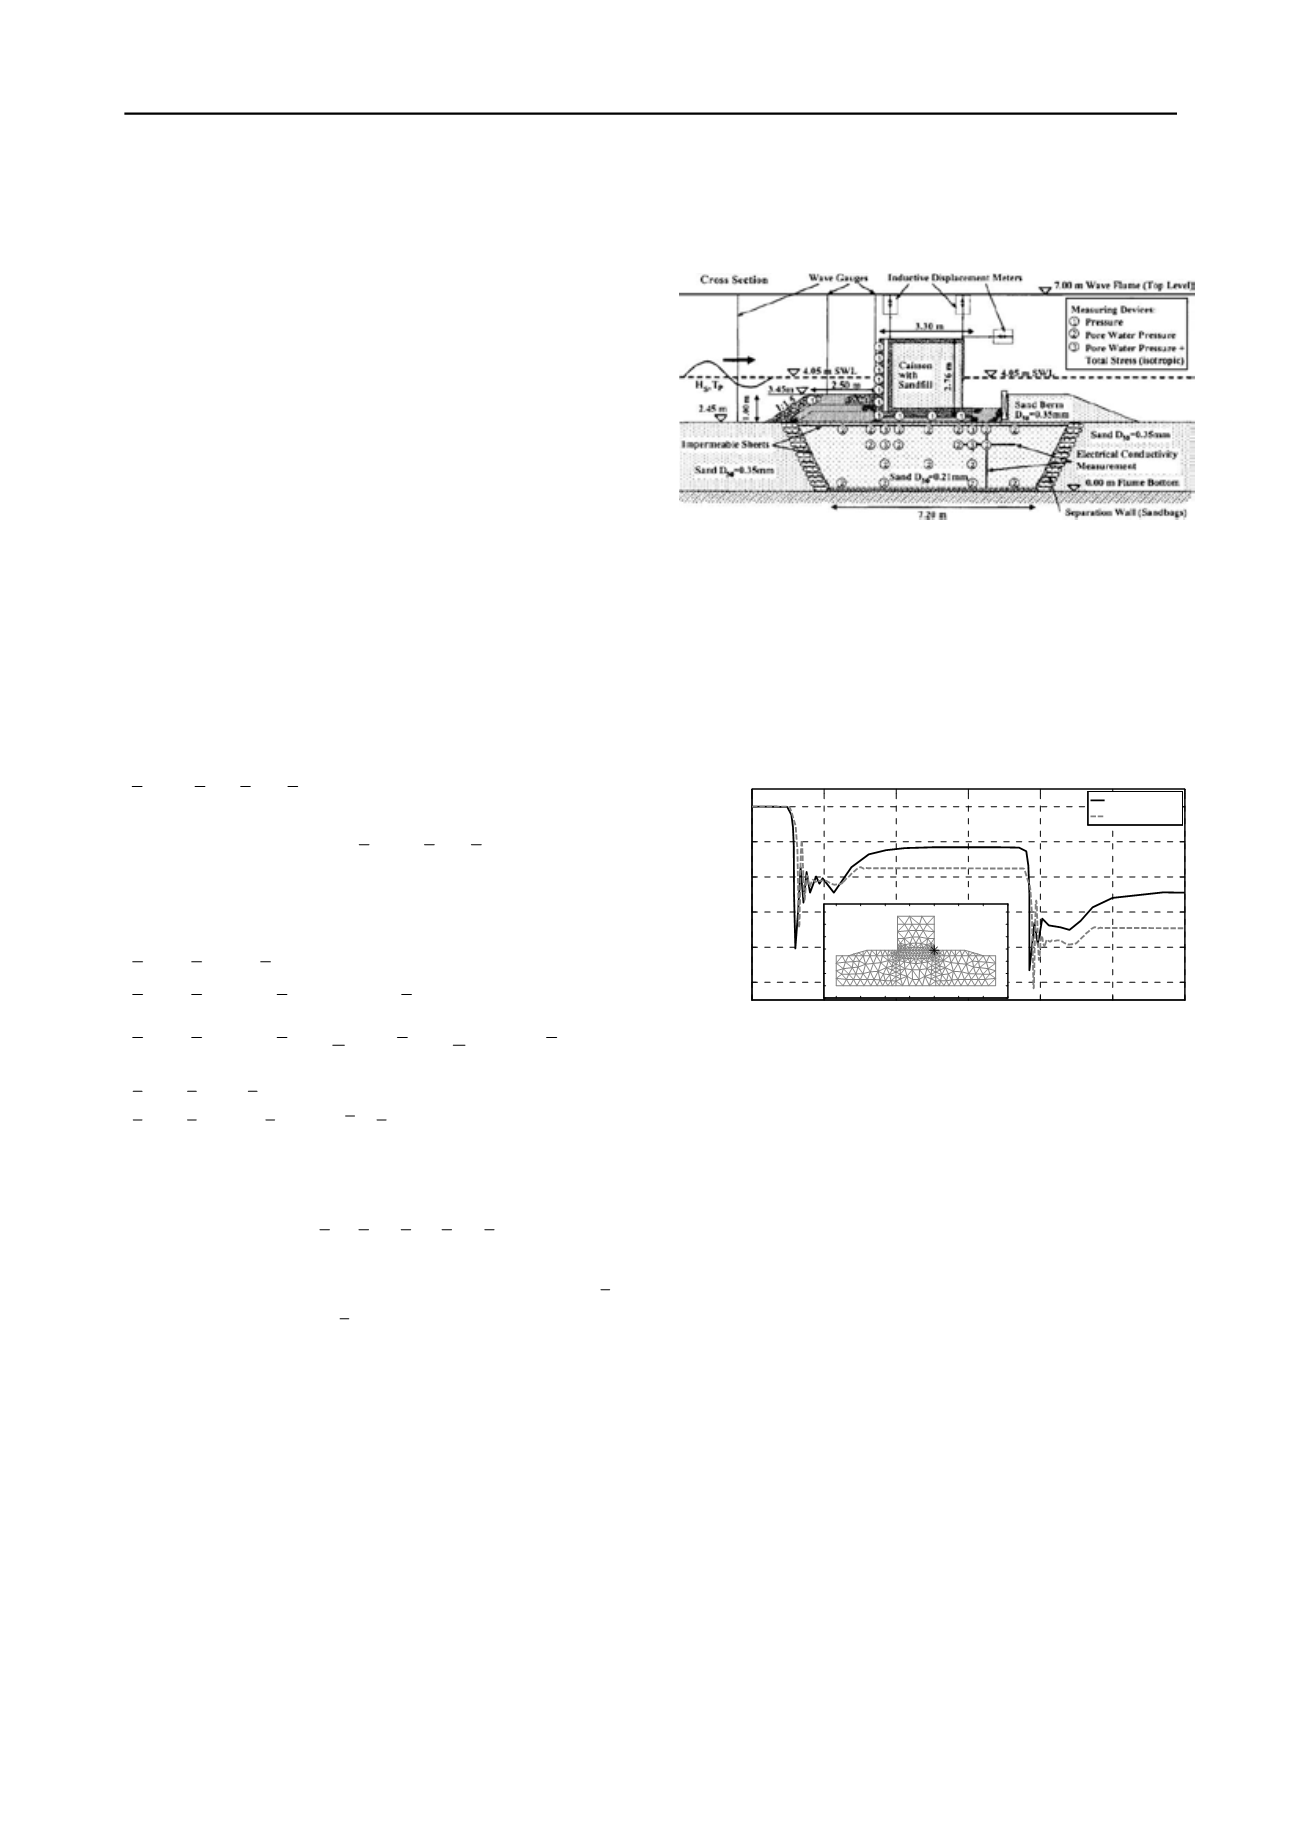
The cross section of the large scale model test model,
including the position of the transducers used at the caisson and
its foundation are shown in Figure 3. The sand beneath the
caisson was selected as fine as practicably feasible with
D
50
=0.21mm,
D
10
=0.13mm y
D
60
/
D
10
=1.69. The initial relative
density, was estimated to vary between
D
r
=0.15 and
D
r
=0.33.
The sand beneath the caisson was rinsed to achieve the highest
practicably feasible saturation value.
The seaward berm consists of a 35cm thick armor layer, a
20cm filter layer and a 45cm core. The caisson is placed on a
20cm thick rubble layer.
Figure 3. Large scale model setup with location of the measuring
device, after Kudella 2006.
Considering the model setup, the test program performed by
Kudella and Oumeraci was able to obtain breaking wave impact
loads.
The model proposed in the present paper has been able to
reproduce adequately the principal characteristics of the caisson
oscillations and instantaneous pore pressure generation
experimentally deduced under breaking wave impact loads
(Figure 4, Figure 5).
0
2
4
6
8
10
12
-10
-8
-6
-4
-2
0
x 10
-4
Time [s]
Vertical Displacement [m]
0
2
4
6
8
10
12
14
-1
0
1
2
3
4
5
6
Experimental
Numerical
A
Figure 4. Numerical and experimental vertical displacement at
shoreward caisson edge induced by two impulsive sea wave actions
(H=0.6m, T=6.5s, h
s
=1.6m, h
1
=0.6m).
In Figure 4 and 5 is possible to observe that under impulsive
wave actions, define by the height wave (
H
), the wave period
(
T
), the water deep at toe of the structure (
h
s
) and the water deep
over seaward berm (
h
1
), the excess pore pressure trace follows
closely the caisson vertical displacement. There is no excess
pore pressure variation until the movement of the caisson starts.
As the rear edge of the caisson moves downwards, the soil layer
compacts inducing a positive excess pore pressure. The pore
pressure increase ends at the same time as the shoreward edge
of the caisson begins to move upwards. The caisson oscillation
experimented after the peak vertical displacement is accurately
followed by an excess pore pressure oscillation. After this
oscillations, the rear edge of the caisson returns partially to its
original position with a correlated decrease in excess pore
pressure.


