3500
Proceedings of the 18
th
International Conference on Soil Mechanics and Geotechnical Engineering, Paris 2013
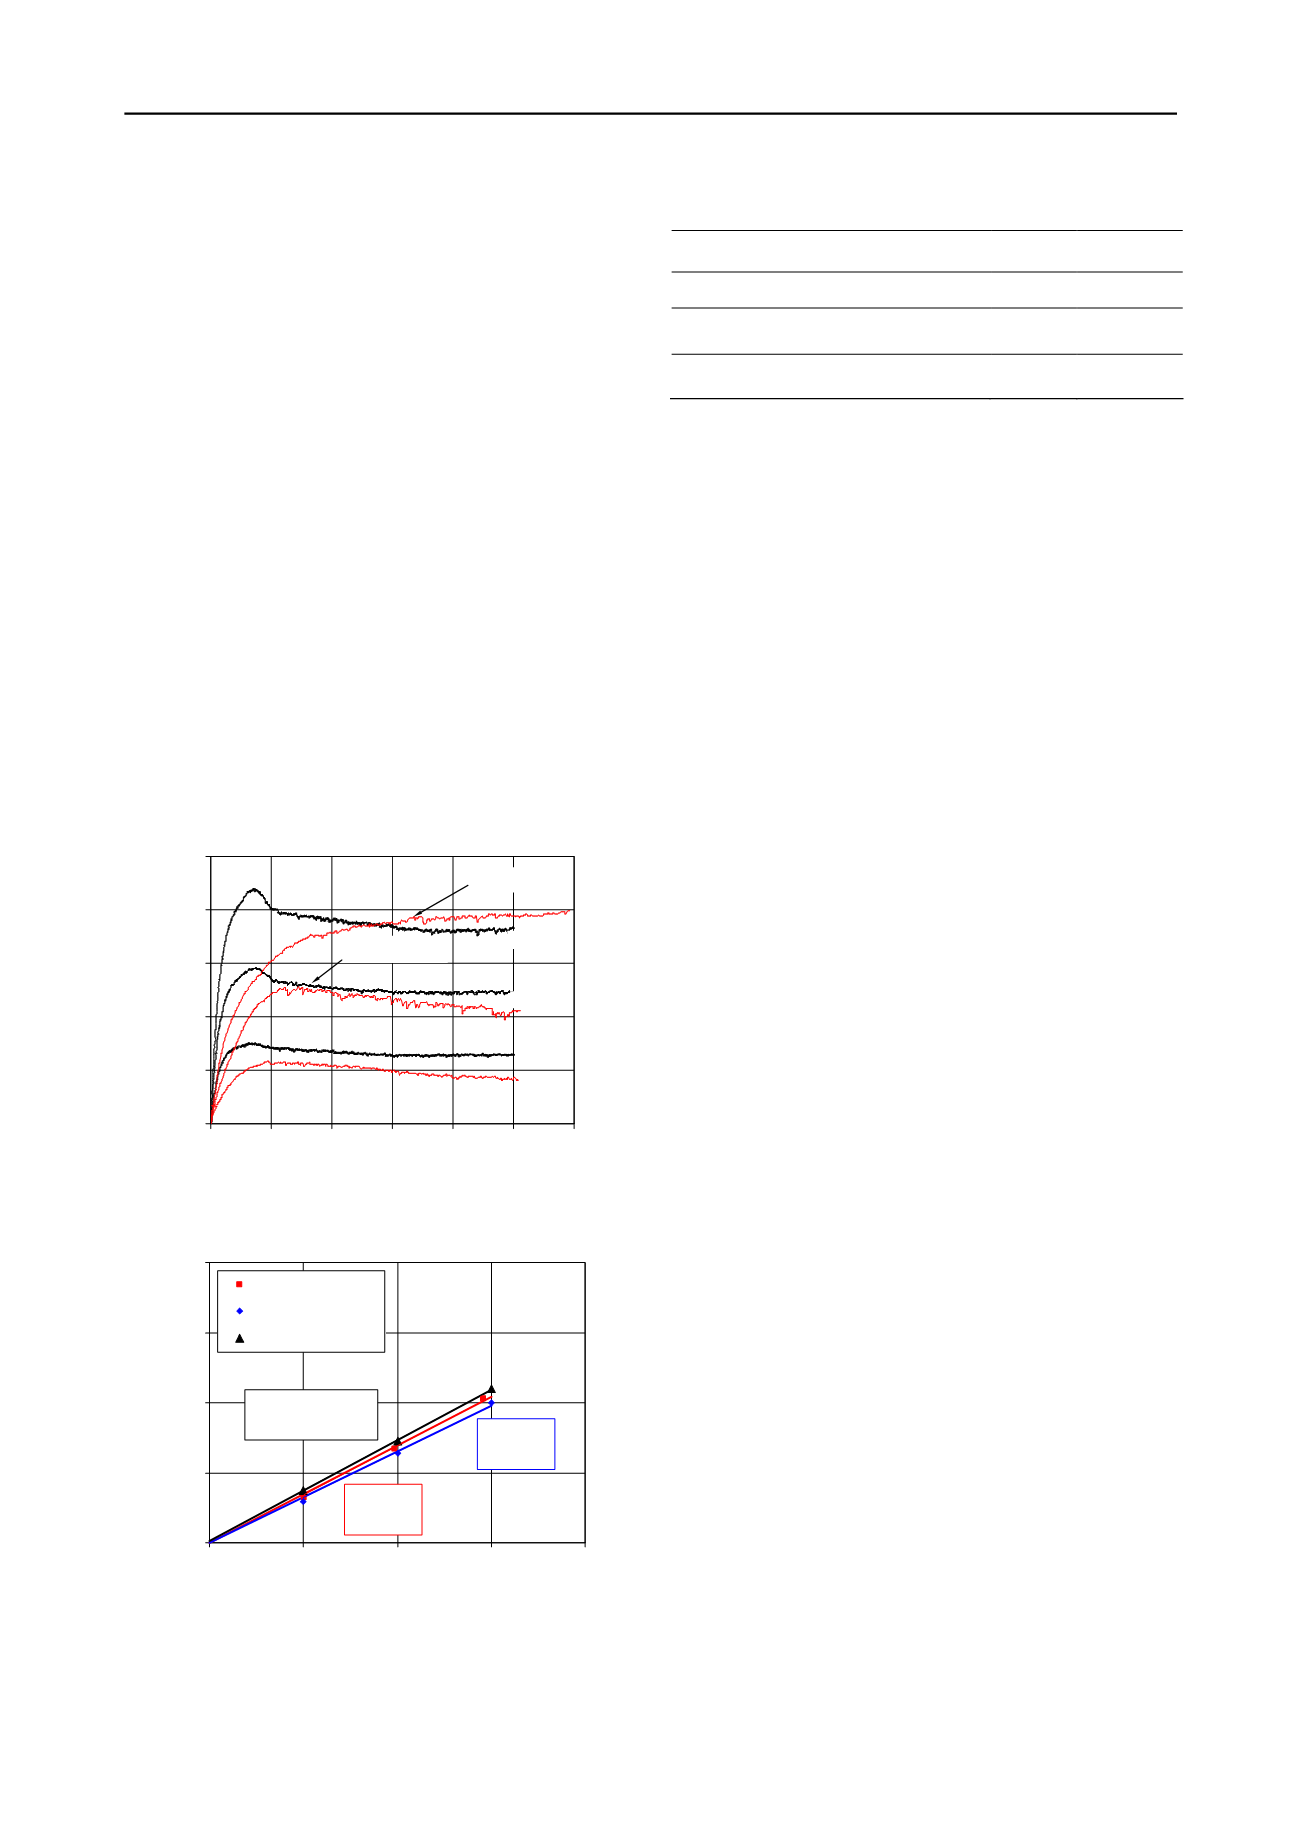
The shear stress-shear displacement curves obtained with the
large scale direct shear tests tend to exhibit peak shear strength,
not evident in the results achieved with the conventional
apparatus. The maximum shear strengths reached with two
devices are relatively close however they were achieved for
lower values of the normalized shear displacement in the larger
box.
Figure 10 compares the failure envelope obtained with
simple shear tests for reinforced sand and the failure envelopes
achieved in the direct shear tests (DS) performed with both
devices (60 mm
×
60 mm and 300 mm
×
600 mm) to
characterize the interface between the sand and the geotextile.
It should be noted that, while the direct shear tests
characterize the interface between the two materials (sand and
geotextile), the simple shear tests analyze the behaviour of the
reinforced sand. Despite this difference, the analysis of Figure
10 shows that the shear strength of the reinforced sand
approaches the shear strength of the sand/geotextile interface.
Table 1 summarizes the values of the friction angle and
apparent adhesion relating to the failure envelopes for the direct
shear tests and simple shear tests (reinforced sand).
Comparing the interface shear strength (evaluated with direct
shear tests), it was found that it tends to be higher when large
scale apparatus was used. As mentioned previously, the shear
strength of the reinforced sand reached with simple shear tests
approaches the shear strength of the interface between the two
materials obtained with direct shear tests. The friction angle of
the reinforced sand is within the range of values achieved with
the two direct shear devices.
0
25
50
75
100
125
0 0.02 0.04 0.06 0.08 0.1 0.12
∆
shear
/L
Shear stress (kPa)
300mmx600mm
60mmx60mm
50 kPa
150 kPa
100
Figure 9. Comparison of shear stress-shear displacement curves
obtained with two direct shear test devices.
τ
= 0.6932
σ
R
2
= 0.9961
τ
= 0.6525
σ
R
2
= 0.9939
τ
= 0.7208
σ
+ 1.4161
R
2
= 0.9998
0
50
100
150
200
0
50
100
150
200
Normal stress(kPa)
Shear stress (kPa)
Simple Shear
DS 60mm x 60mm
DS 300mm x 600mm
Figure 10. Comparison of the failure envelopes of sand SP49 reinforced
with geosynthetic GC100 obtained with three shear devices.
Table 1. Comparison of the shear strength parameters reached with
different devices.
Test
adhesion
(kPa)
Friction
angle (º)
Direct Shear Test (300mm
×
600mm)
1.4
35.8
Direct Shear Test (60mm
×
60mm)
-
33.1
Simple Shear Test
-
34.7
6 CONCLUSIONS
Based on the analysis and interpretation of the results of direct
shear tests performed to characterize the interface between a
silica poorly graded sand and a high strength geotextile and the
results achieved by simple shear tests carried out with the sand
reinforced with one layer of geotextile, the following
conclusions can be drawn.
From the direct shear tests it was concluded that the large
scale device overestimates the shear strength of the soil-
geosynthetic interface comparatively to the results obtained
with the conventional direct shear apparatus. Notice, however,
that the large scale direct shear device should represent more
accurately the real behaviour of the interface. Nevertheless, the
differences between the results obtained with the two devices
are not significant.
Although the characterization reached by the simple shear
tests is distinct from that of the direct shear tests, it can be stated
that the shear strength of the anisotropic material (sand and
geosynthetic) approaches the shear strength of the interface
between the two materials.
The conclusions presented are also valid for interfaces
between other materials (Vieira, 2008).
7 ACKNOWLEDGEMENTS
The authors would like to thank the financial support of
Portuguese Science and Technology Foundation (FCT) and
FEDER, Research Project FCOMP-01-0124-FEDER-009750 -
PTDC/ECM/100975/2008.
8 REFERENCES
Evgin, E. & Fakharian, K., 1998, Cyclic Rotational Simple- Shear
Behaviour of Sand-Steel Interfaces. Soils and Foundations, 38(2):
191-199.
Hsieh, C. & Hsieh, M.-W., 2003, Load plate rigidity and scale effects
on the frictional behavior of sand/geomembrane interfaces.
Geotextiles and Geomembranes, 21: 25-47.
Lee, K. M. & Manjunath, V. R., 2000, Soil-geotextile interface friction
by direct shear tests. Canadian Geotechnical Journal, 37: 238-252.
Ling, H. I., Burke, C., Mohri, Y. & Matsushima, K., 2002, Shear
Strength Parameters of Soil-Geosynthetic Interfaces Under Low
Confining Pressure Using a Tilting Table. Geosynthetics
International, 9(4): 373-380.
Liu, C.-N., Ho, Y.-H. & Huang, J.-W., 2009, Large scale direct shear
tests of soil/PET-yarn geogrid interfaces. Geotextiles and
Geomembranes, 27(1): 19-30.
Palmeira, E. M., 1988, Discussion on direct shear tests on reinforced
sand. Geotechnique, 38(1): 146-148.
Uesugi, K. & Kishida, H., 1986, Fricional resistance at yield between
dry sand and mild steel. Soils and Foundations, 26(4): 139-149.
Vieira, C. S., 2008, Geosynthetic reinforced soil retaining walls and
slopes. Seismic behaviour and design methodologies, PhD Thesis,
Civil Engineering Department, University of Porto, 575 p (in
Portuguese).
Vieira, C. S., Lopes, M. L. & Caldeira, L. M., 2013, Sand-geotextile
interface characterization through monotonic and cyclic direct shear
tests. Geosynthetics International (accepted for publication, Vol.
20, No. 1).


