3493
Technical Committee 101 - Session I /
Comité technique 101 - Session I
can roll and slide beneath the larger particles and be partially or
even entirely hidden from view. As such, the TST shown in
Figure 5 provides a nominal segregation of particles by size.
This is accomplished by temporarily inclining the TST and
introducing a soil specimen at the top of the incline. The
particles roll and slide down the slope passing beneath a series
of bridges of decreasing underpass height, thus segregating the
particles by size. While the TST prevents smaller particles from
hiding behind larger ones, the particles may still be in contact
with one another. After lowering the table and removing the
bridges, the TST is photographed from above. The photograph is
converted into a binary image and
watershed analysis
(Ghalib
and Hryciw 1999) segments the contacting particles. Figure 6
shows a typical TST test result. Additional TST details are
provided by Hryciw and Ohm (2012).
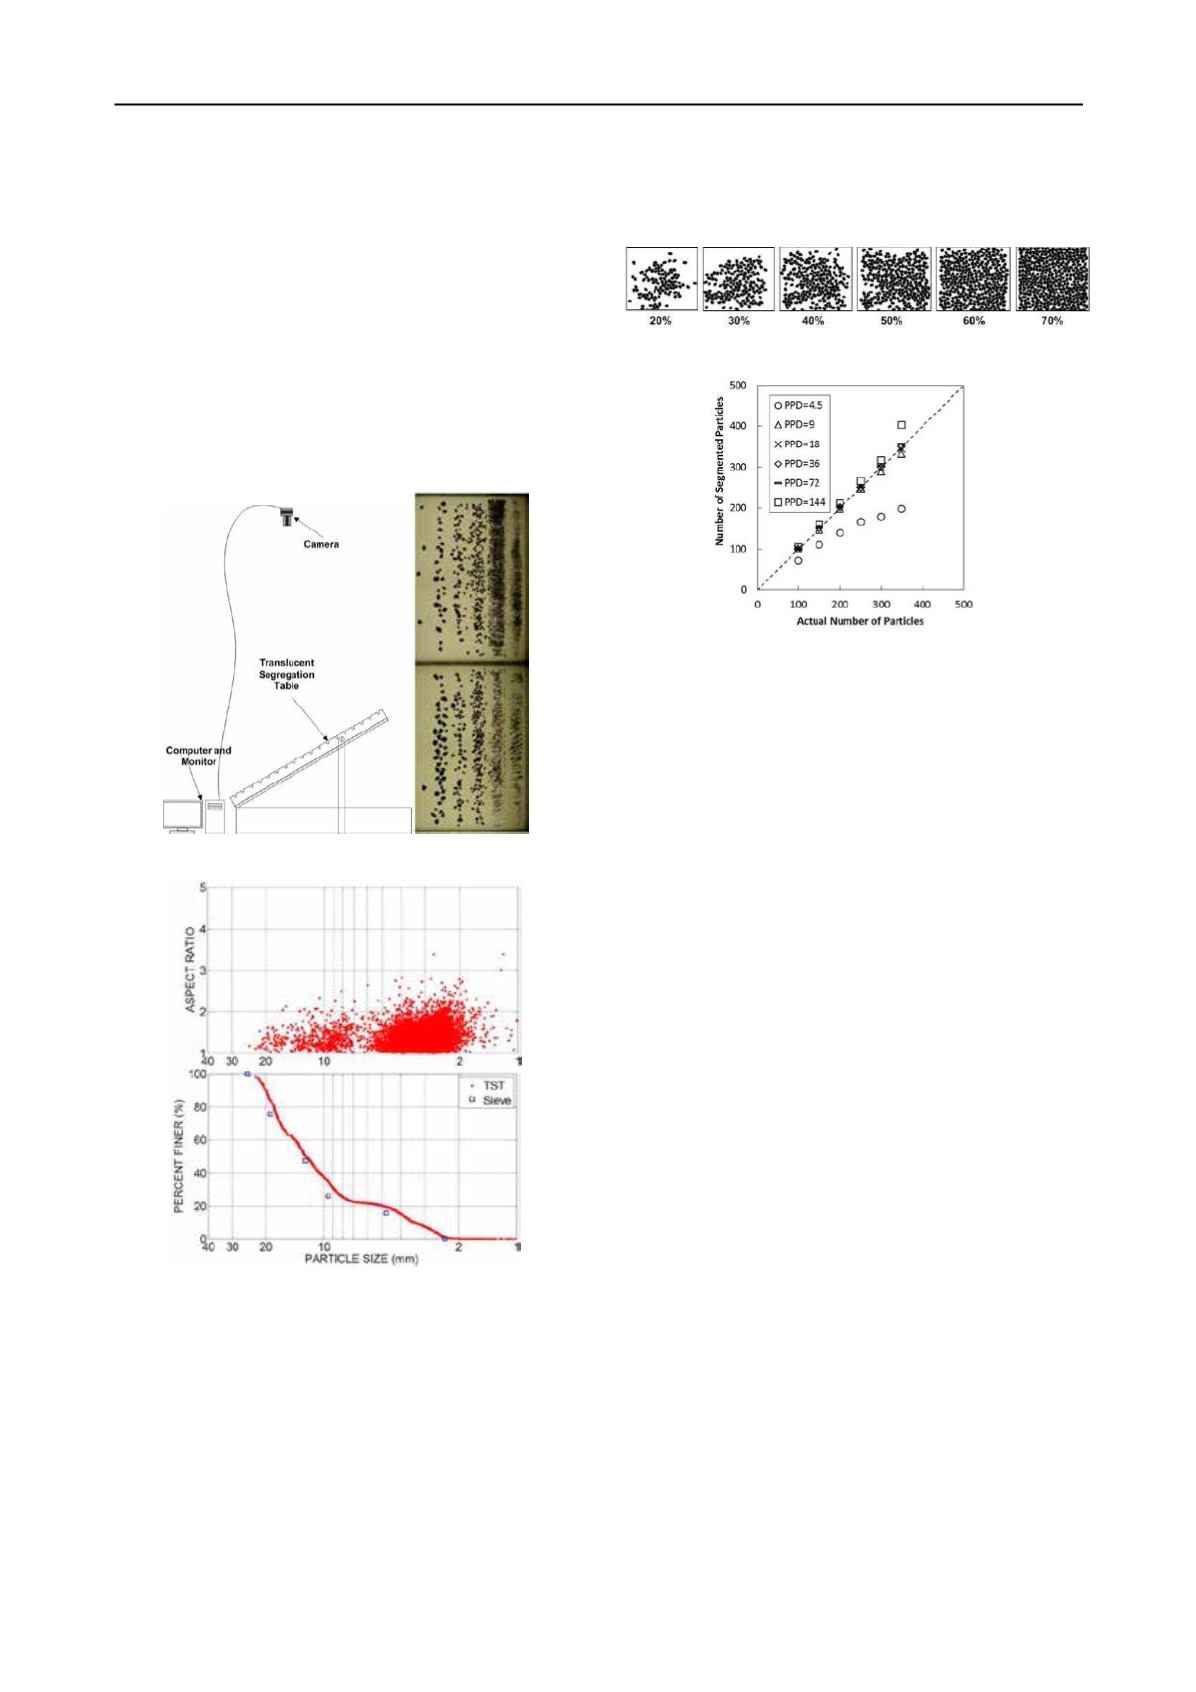
Figure 5. Translucent Segregation Table (TST).
Figure 6. Typical TST result with comparison to sieving.
The minimum
PPD
for the TST test is dictated by the
watershed segmentation method and the need to adequately
define the particles’ projected areas. To find this minimum
PPD
,
different quantities of coffee beans were placed on the TST and
photographed. The percentage of the image area covered by the
coffee beans was varied from 20% to 70% as shown in Figure 7.
Different
PPD
s were generated by digital downscaling of the
original images. Figure 8 compares the number of segmented
particles by watershed analysis at different
PPD
s to the number
of actual coffee beans. Conservatively, the minimum
PPD
to
detect all of the particles appears to be 9. It is also noted that
even with a coverage area of 70% (i.e. very high contact
between particles) watershed segmentation successfully
identified virtually all of the beans. Note that the minimum
PPD
for the TST is three times larger than the minimum
PPD
for
Sedimaging. This is because the TST uses a deterministic
method that requires good particle perimeter resolution for
watershed analysis while Sedimaging uses a statistical method
that does not require such resolution.
Figure 7. Different image coverage by coffee beans.
Figure 8. Comparison of segmented versus actual number of coffee
beans in the TST for various
PPD
.
6 DISCUSSION
The minimum required
PPD
s for the Sedimaging and TST tests
are dictated by their respective image analysis methods.
However, this is only one factor that will control the minimum
particle size that can be determined in each test with a given
camera. The other factor is the area to be photographed. The
Sedimaging test requires a specimen weight of 450 g to 500 g.
This weight yields a loose sedimented soil column height of no
more than 135 mm. For the TST, the longer dimension of the
table that must appear in the image is 910 mm. This allows for
single- image testing of 1.0 to 1.5 kg specimens. With these
requisite parameters and the minimum
PPD
requirements of 3
for Sedimaging and 9 for the TST, the capabilities of four
cameras with different resolutions are compared in Table 1. The
cameras were selected to represent digital capabilities of the
early 2000’s (6.1 MP), the presently used Nikon D7000 (16.2
MP) and potential usage of higher resolution Nikon D800 (36.3
MP) and Leaf Credo (80 MP) cameras. While the actual costs of
digital cameras decrease regularly, if the current (2012) D100
cost was set at 100 arbitrary currency units, the other three
cameras would cost 800, 2500 and 40000 respectively.
The longer Sedimaging and TST image dimensions and the
larger of the two pixel resolution directions dictate the required
magnification in units of pixels/mm. The required
PPD
then
establishes the smallest particle size that can be resolved. Table
1 reveals that the target particle sizes (0.075 mm for Sedimaging
and 2.0 mm for the TST) could not be achieved with DSLR
cameras in the 2000’s. By contrast, currently available cameras
are well suited for characterizing particles well into the silt range
by Sedimaging and below 1.0 mm by the TST. These
calculations suggest that particles in the 2.0 mm to 1.0 mm range
could be tested in the TST rather than by Sedimaging. Such a
seemingly small decrease in the maximum particle size for
Sedimaging would have profound implications to the size and
cost of the system. By reducing the maximum particle diameter
by 50% the cross section of the sedimentation column could be
reduced from (50 mm)
2
to (25 mm)
2
. At the same time, the
column height could be reduced by more than 50% since settling
velocity is proportional to the square of the particle diameter and
settling velocity controls particle segregation. The presently
large Sedimaging system could become a portable device.


