3499
Technical Committee 101 - Session II /
Comité technique 101 - Session II
relative density (I
D
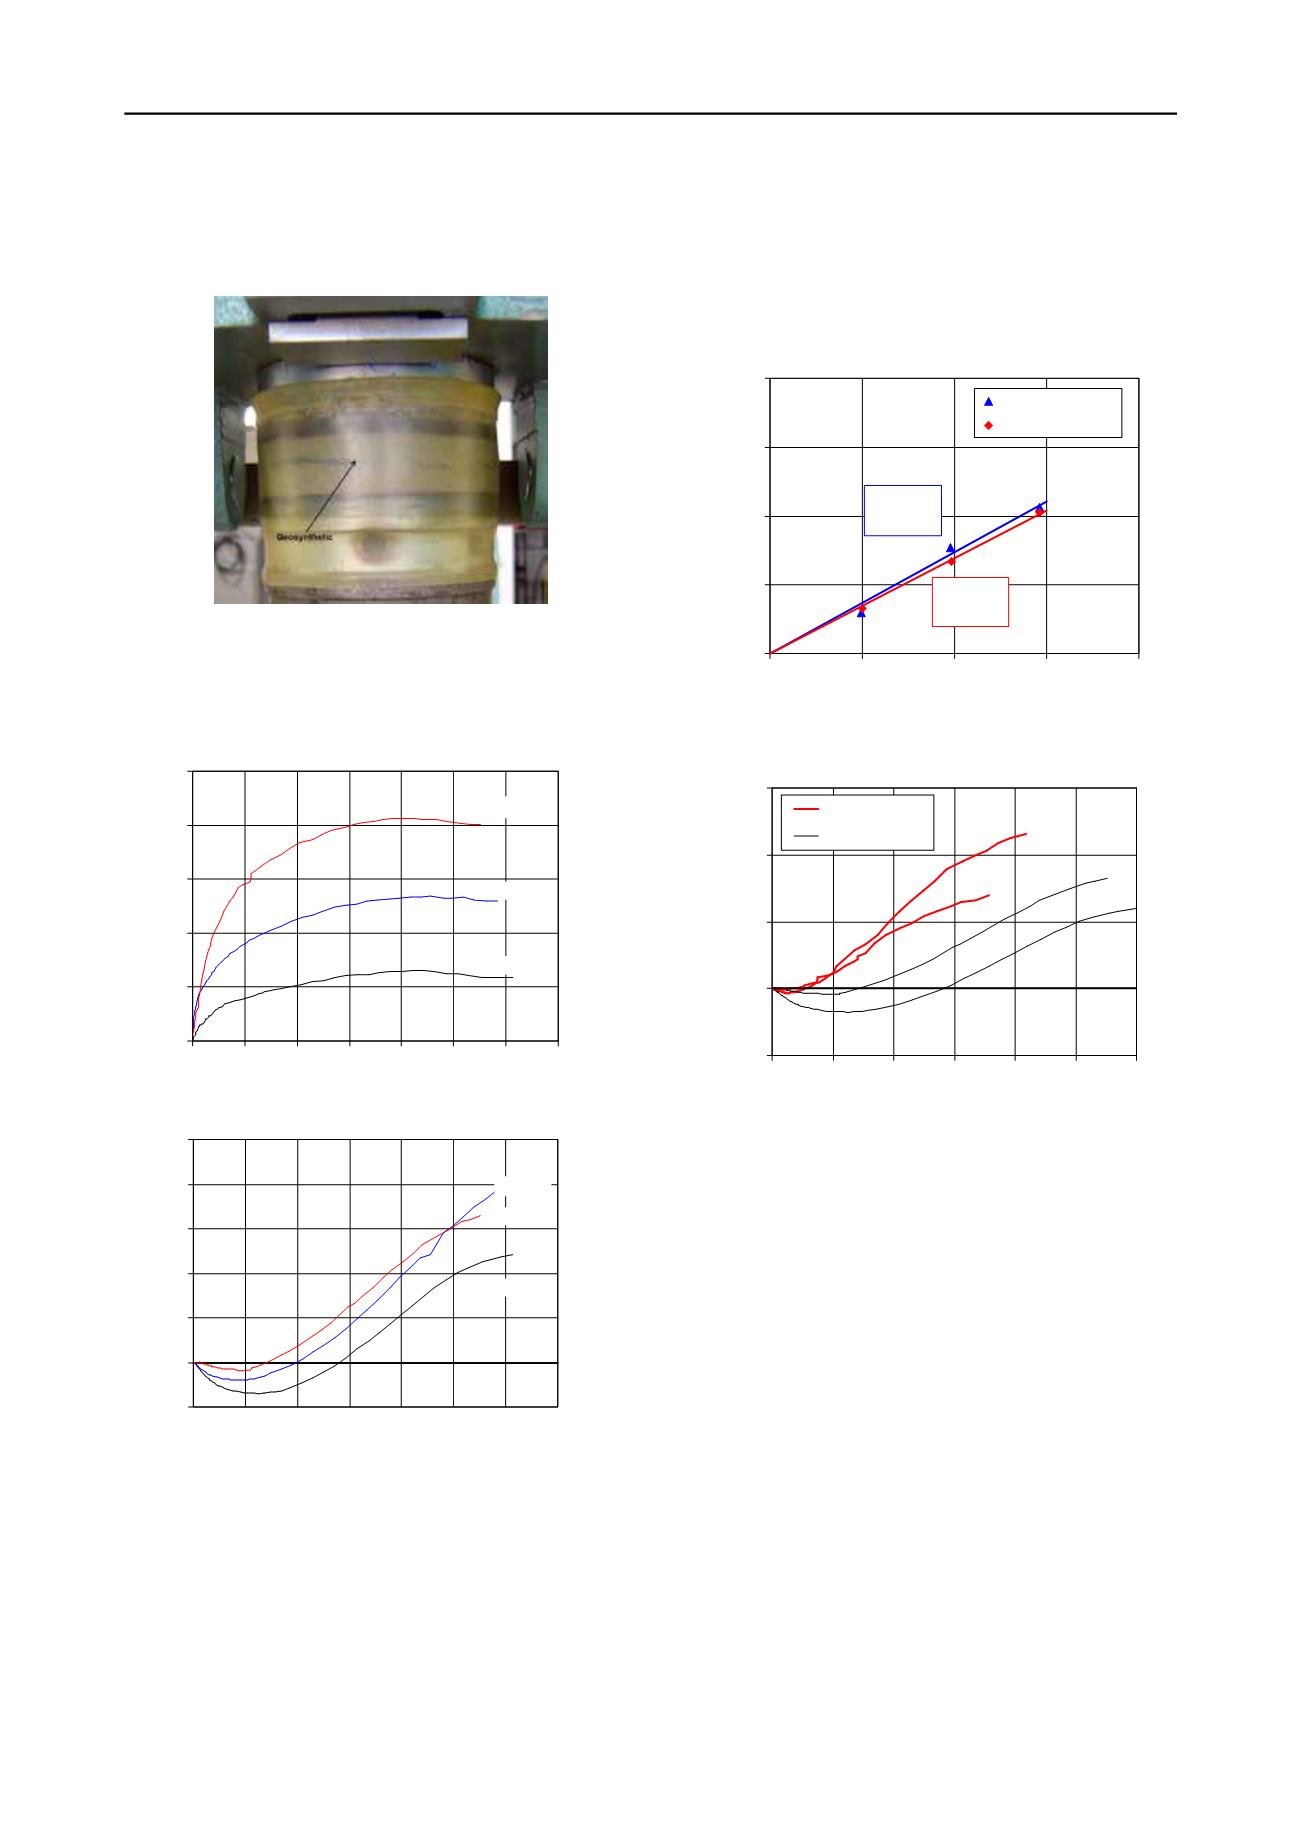
= 70%). The sand was deposited in two
layers, being the geosynthetic placed between them. Figure 5
presents a reinforced sand specimen already placed on the
simple shear device.
Figure 5. Geosynthetic reinforced sand specimen for simple shear test.
Figure 6 illustrates the shear stress
versus
shear strain
behaviour, as well as, the vertical displacement of the reinforced
sand specimen during shear.
0
25
50
75
100
125
0 0.05 0.1 0.15 0.2 0.25 0.3 0.35
δ
h
/H
0
Shear stress (kPa)
50 kPa
100 kPa
150 kPa
(a)
-0.5
-0.4
-0.3
-0.2
-0.1
0
0.1
0 0.05 0.1 0.15 0.2 0.25 0.3 0.35
δ
h
/H
0
Vertical displacement (mm)
50 kPa
100 kPa
150 kPa
(b)
Figure 6. Simple shear tests results for reinforced sand: (a) shear stress-
shear strain behaviour; (b) vertical displacements during shear.
The maximum shear strengths for the three values of the
confining pressure and the failure envelopes for unreinforced
and reinforced sand are compared in Figure 7. Unexpectedly,
the shear strength of the reinforced sand tended to be lower than
the shear strength of the unreinforced sand. This evidence is
probably justified by the fact that the presence of the
reinforcement led to a looser layer of sand over the
geosynthetic, due to the damping caused by its presence during
the deposition process of the sand.
Figure 8 confirms the hypothesis above-mentioned. When a
reinforcement layer is placed within the specimen, greater
settlements (positive values of the vertical displacements) were
recorded and the dilatant phase had less significance. To
simplify the figure, it was decided to present only the vertical
displacements related to the tests performed with the highest
and lowest value of the normal stress.
τ
= 0.7381
σ
R
2
= 0.9757
τ
= 0.6932
σ
R
2
= 0.9961
0
50
100
150
200
0
50
100
150
200
Normal stress (kPa)
Shear stress (kPa)
Unreinforced sand
Reinforced sand
Figure 7. Comparison of the failure envelopes for unreinforced and
reinforced sand.
-0.6
-0.4
-0.2
0
0.2
0
0.05 0.1 0.15 0.2 0.25 0.3
δ
h
/H
0
Settlement (mm)
Unreinforced sand
Reinforced sand
150 kPa
50 kPa
150 kPa
50 kPa
Figure 8. Comparison of vertical displacements of the specimen in
simple shear tests on unreinforced and reinforced sand .
5 COMPARISON OF THE RESULTS
Prior to the comparison of the results achieved with the
developed large scale direct shear device and those obtained
with simple shear tests, it will be analyzed the scale effect of the
direct shear box on the sand-geotextile interface shear strength.
Regarding the influence of the dimensions of the shear boxes
on the test results, contradictory opinions can be found in the
literature. Palmeira (1988) stated that the scale effects do not
affect the peak value of the friction angle obtained from direct
shear tests. Hsieh and Hsieh (2003) found that, in general, the
shear strength obtained in shear boxes with large dimensions is
greater than that obtained with smaller shear boxes.
Notwithstanding the fact that the conventional direct shear
device can only accommodate small size specimens, which
might impose serious limitations in terms of reproducing real
conditions, direct shear strength for several interfaces obtained
with the developed device were compared by Vieira (2008) with
results achieved in a small (60 mm
×
60 mm) conventional
direct shear apparatus. Figure 9 presents the evolution of the
shear stress with the shear displacement, normalized by the
length of the box, obtained with the large scale and the
conventional direct shear devices for the interface under
analysis in this work.


