3510
Proceedings of the 18
th
International Conference on Soil Mechanics and Geotechnical Engineering, Paris 2013
2 EXPERIMENTAL METHOD
One dimensional consolidation tests were conducted with
commercial kaolinite. Reconstituted kaolin clay slurry
specimens were prepared at 26% water content, compared to the
liquid limit of 22%. The test programme was composed of 15
consolidation tests. These fifteen tests can be grouped into five,
according to the five different maximum stress levels that were
applied at the end of the tests, which were 20, 50, 100, 200 and
400 kPa’s. In addition to this grouping, three sub-groupings
were defined according to the duration of application of
maximum stress levels; which are 15, 1440 and 4320 minutes.
In each of these tests, starting with an initial stress level of 2.5
kPa, loading increments were increased with a ratio of 2, and
each was sustained for 24 hours. At the maximum vertical
pressure stage specific to the group, (the tests were ended
abruptly for sampling at different times (15, 1440 and 4320
minutes) for each of the five samples that constitute one test
group. Dimensions of the samples extracted at the end of these
durations is1cmx1cm. Retrieved vertical undisturbed specimens
were used in the ESEM analyses. Thus, there were 15
specimens to be used for observation of the micro behavior,
each having different “consolidation level-maximum
consolidation pressure” combinations. Three photographs were
taken from each of the specimens and thus in total there were 45
photographs to be analyzed. Image analyses were conducted to
investigate the implications of the influence of both the load
increments and consolidation degrees on the micromechanical
behavior.
3 IMAGE ANALYSIS
3.1
The Method
Image processing was conducted using the open source program
ImageJ (Rasband 2009). Isodata threshold algorithm of 256
grey level images was used to distinguish clay aggregates from
inter-aggregate voids. Brightness value of pixels above the
threshold was established as indicating clay aggregates. This
image was then converted to a binary image in which black and
white represents clay aggregates and inter-aggregate voids
respectively. The pixel size in the ESEM micrographs was
8.47*10
-2
µ
m which corresponds to a size in the range of large
enclosed pores within groups (macro voids). Binary images
were segmented by the watershed function. Using this analysis,
particles of all recordable sizes can be detected (Yigit 2010,
Yigit and Cinicioglu 2011). Photographs show the planes that
have normal, orthogonal to the loading direction, therefore
reflect the positioning of the particles on the vertical plane. A
raw photograph and its processed version are shown in Fig.1.
Figure 1. Raw (left hand side) and Processed Micrographs.
3.2
Interpretation of structure in terms of clump sizes
The gradation curves were found by applying a technique
similar to that used in the presentation of sieve analyses results,
but in this case the application was conducted on digitized
micrographs. In this context, discrete clusters were detected and
then grouped in the order of their areal sizes. The applied range
for particle areas is between 0.1-100
µ
m
2
. By dividing the total
area of each size group to the total area of the entire clusters,
“per cent retained” values were found and the cluster gradation
curves were drawn in terms of per cent passing against area
sizes in decreasing order, for a specific loading duration, as
shown in Figs. 2.a and 2.b for load durations of 15, 1440 and
4320 minutes.
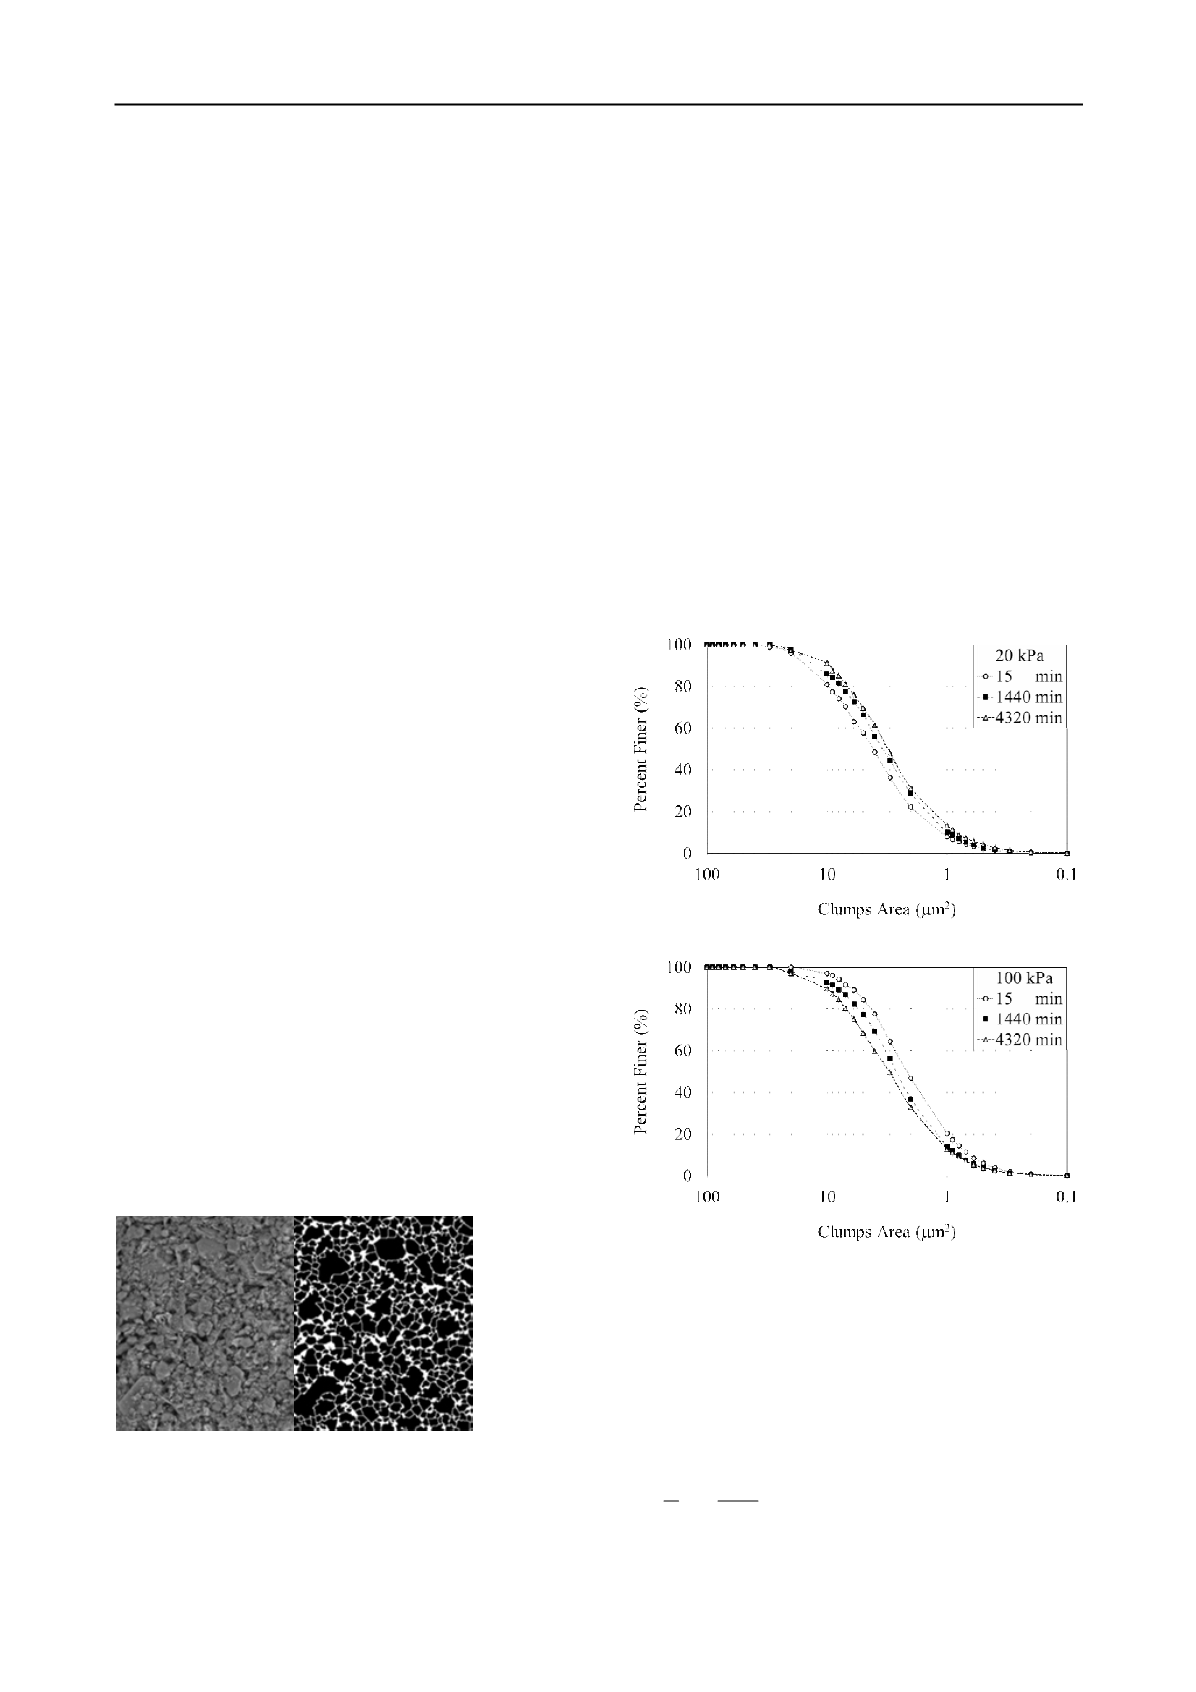
In order to analyze the gradation curves, in terms of degree
of fineness, a threshold cluster size was chosen and the per cent
passing value corresponding to the chosen clump size was
defined as Per cent Finer (PF), to give the percentage of clusters
finer than the threshold. Therefore increases in PF values are
associated with disintegration into finer sizes and decreases are
associated with clump formation into larger sizes. Fig. 2.a and
2.b give two different tendencies in cluster size variation. For
load increment of 20 kPa in Fig. 2.a, clusters become finer with
increasing load duration but in Fig. 2.b, for 100 kPa load
increment, a reverse order is apparent; implying clump
aggregation as the time proceeds. It can be argued that, the
variation in cluster sizes is influenced by the stress state, time
and the initial structural state respecting to the starting state of
the current load increment.
Figure 2. Variation of clump gradation curves for (a) 20 kPa and (b) 100
kPa load increments with loading duration.
4 TIME DEPENDENT BEHAVIOUR
Yin (1999), suggested a non-linear creep function with a limit
creep strain. The function proposed by Yin (1999) and
reproduced in Eq. 1 is advantageous due to its ability to
represent nonlinear creep behavior of soils and its simplicity.
0
0
ψ
t + t
ε
= Ln
v
t
(1)
where,
∆ε
is the creep strain, t is the creep time for
∆ε
, t
0
is the
reference time,
ψ
/v is the creep parameter used in the 1-D EVP


