3511
Technical Committee 105 /
Comité technique 105
models (Yin & Graham 1994) and v is the specific volume.
From Eq. 1
ψ
/v can be expressed as,
'
0
'
0
1
0
0
ψ
ψ
=
v 1+ (
ψ
/
ε
)Ln[(t + t ) / t ]
(2)
Where
∆ε
1
is the limit creep strain,
ψ
0
΄
is the value of
ψ
/v at the
reference time. Eq. 2 dictates that
ψ
/v is not a constant and
decreases with creep time, and also it can be stated that
ψ
/v is
dependent on the stress level.
In this study, the creep function by Yin (1999) was used to
interpret the time-dependent creep behavior, prevalent in the 1-
D consolidation tests. Vertical strain-time relations were
configured into time lines by applying Yin (1999) approach. An
example of this application is given in Fig. 3 for the test
conducted up to the 400 kPa stress level and this load was kept
on the sample for 4320 minutes. Only creep phases of the
consolidation tests were considered in this study and the results
of the tests on the reconstituted kaolin clay specimens indicated
that end of primary consolidation times correspond to
approximately 15 minutes or less. The parameters,
ψ
0
΄
and
∆ε
1
,
and thus the time lines were calculated for all the test groups
with load applications up to 20, 50, 100 200 and 400 kPa stress
levels and 15, 1440 and 4320 minutes of duration. In
accordance with Yin (1999) approach, limit time lines were also
determined and displayed on the graphs.
Figure 3. Time lines for the 400 kPa test.
5
Ψ
/V AND PF RELATION
As stated before, Eq. 2 gives the creep parameter,
ψ
/v
decreasing with time. In the same sense, the gradation curves
given in Fig. 2 imply the variation of PF values with time, but
the variation may change its direction either towards size
enlargement or degradation. Therefore, it can be argued that a
correlation between
ψ
/v and PF may exist. Such a correlation
was searched for by comparing the results of the tests conducted
in the scope of this research programme. Some examples of test
results were presented in Figs. 2 and 3. The summary of the
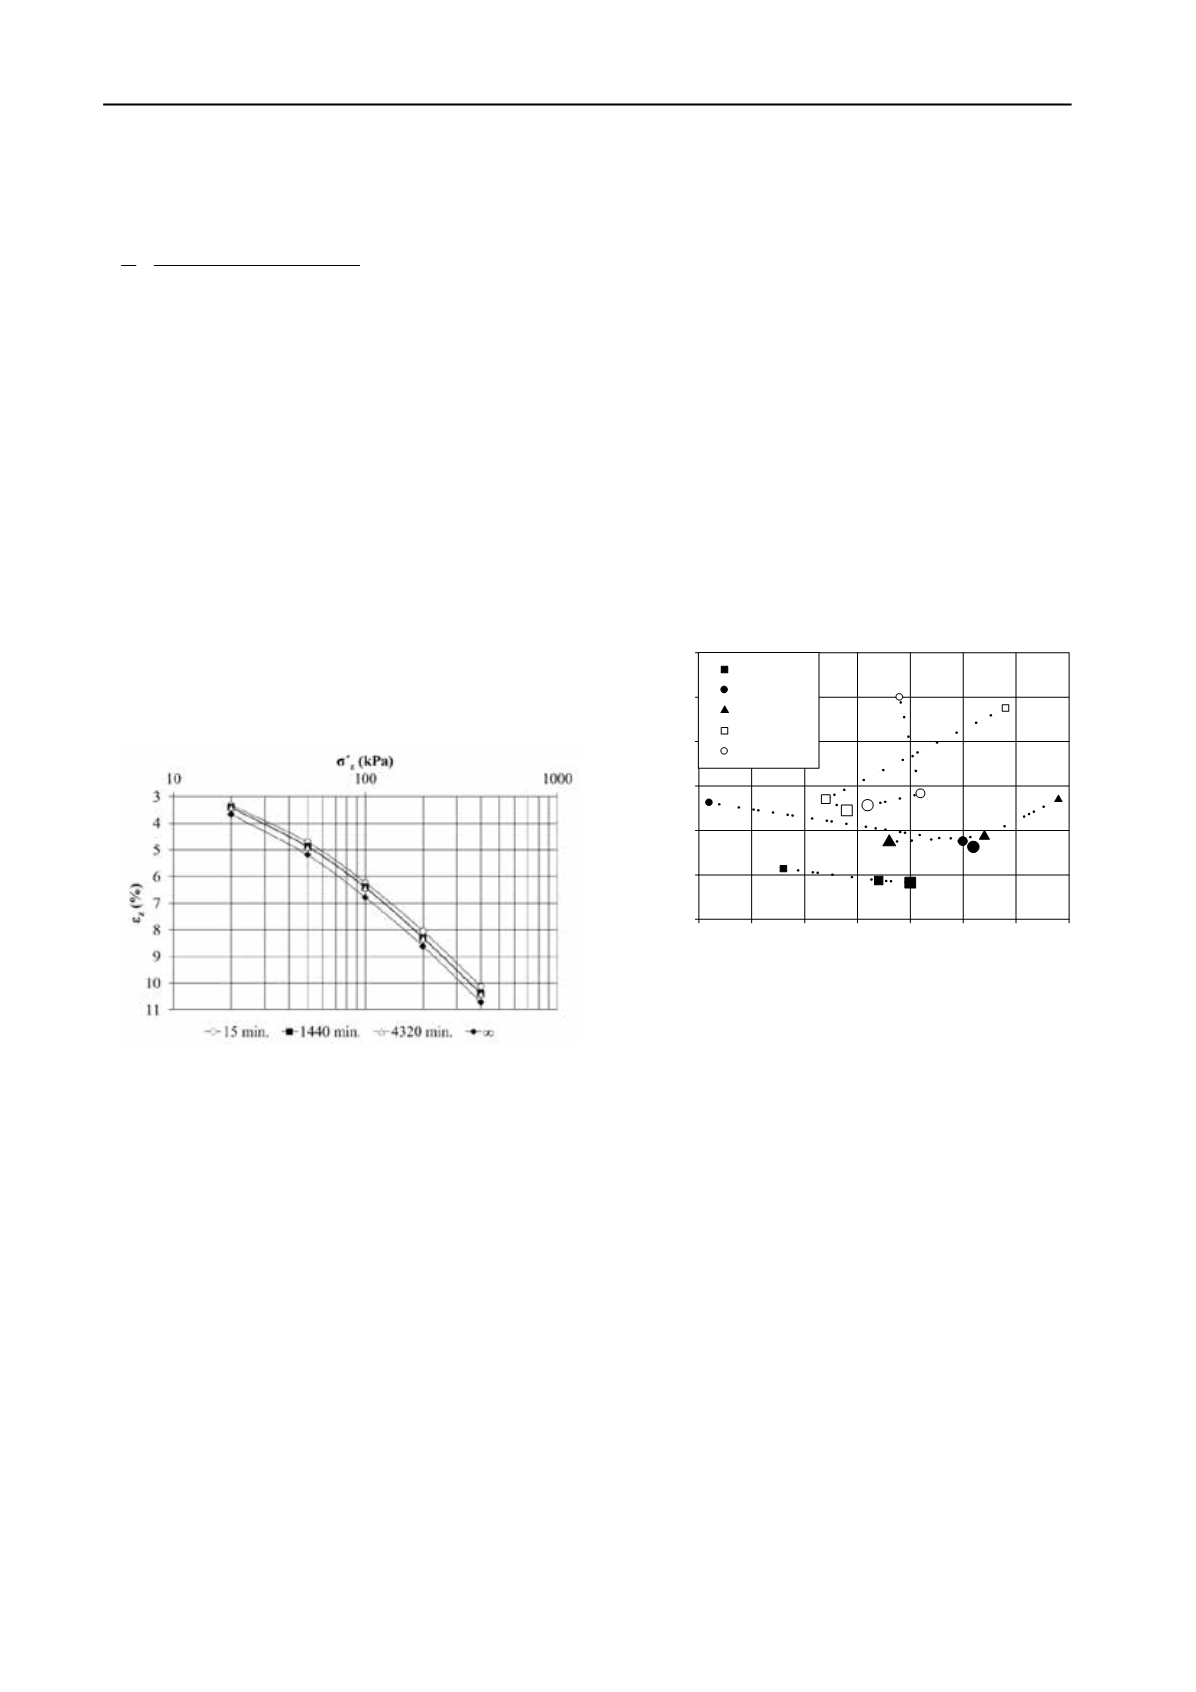
results obtained with this approach are given in Fig. 4 which
shows
ψ
/v - PF relations for each load increment and all load
durations. In Fig. 4, the symbols depicting the data points along
a relationship corresponding to a load increment gets larger in
size as load duration gets longer (e.g. the smallest size
corresponds to 15 minutes and gets larger towards 1440 and
4320 minutes). The relationships displayed in Fig. 4 can be
interpreted either in terms of the tendencies of clump formation
or clump disintegration depending on the direction of variation
in PF values. It can be seen in Fig. 4 that, at low stress levels,
such as 20 and 50 kPa’s, PF increases as load duration
increases. As a matter of course, increases in PF correspond to
clump disintegration. In the scope of the findings presented in
Fig. 4 an opposite behavior seems to be present in case of
higher stress application, 100, 200, 400 kPa stress states. In case
of higher stress states PF values decrease as time proceeds;
implying structure reconfiguration accompanied by clump
formation. Referring to the creep rate parameter it can be stated
that,
ψ
/v decreases with time at all the stress levels. The
correlation between
ψ
/v and PF is negative at stress levels 20
and 50 kPa’s, but positive at stress levels 100, 200 and 400
kPa’s. If the variation of both of the parameters;
ψ
/v and PF
with respect to time was considered, it seems that, both of these
decreases as time proceeds. Moreover,
ψ
/v values are greater at
high stress levels compared to low stress levels, provided that
the load duration is the same for each test. In terms of the sign
of correlation between
ψ
/v and PF it can be stated that, the
stress level, 100 kPa acts as a threshold and at this stress state
and towards higher stress states, the correlation changes sign
from negative to positive. This argument is in accordance with
the findings of McConnachie (1974) who studied the changes in
the sizes of the domains against a large range of pressure; from
0.1 kPa to 100000 kPa’s. McConnachie pointed out the
possibility of occurrence of a fundamental change in the
mechanism of consolidation between the pressures 10 and 100
kPa”.
Percent Finer (%)
50 55 60 65 70 75 80 85
Ψ / ν
(x10 -4 )
0
2
4
6
8
10
12
20 kPa
50 kPa
100 kPa
200 kPa
400 kPa
Figure 4. Relations obtained for the tests at different stress levels.
6 CONCLUSIONS
A specifically designed testing programme was conducted to
investigate the interaction between macro and micro
mechanisms that occur during time dependent consolidation
process. The testing programme consisted five sets of 1-D
oedometer tests; each with a different maximum stress level.
Three duration periods were applied for each set of the tests.
Micrographs were taken at the end of all of the fifteen tests and
quantified in terms of the variation of clump sizes present at any
stress level and time. The results were presented by using an
approach similar to the construction of gradation curves. In
order to analyze the gradation curves, in terms of degree of
fineness, a parameter was defined which is called as Per cent
Finer (PF), to give the percentage of clusters finer than a
specific size that was chosen to act as a threshold. Macro
measurements made during the application of the oedometer
tests and micro measurements obtained through the
quantification process applied on the micrographs provided two
parameters; creep rate parameter,
ψ
/v and Per cent Finer, PF.
The possibility of existence of an interrelationship between
ψ
/v,
and PF was then searched for, as, both of these parameters vary
with respect to creep time. The results can be interpreted in
terms of the existence of a correlation. However, further
evidence supported by larger sets of data is required. Current
results can be summarized as; the creep rate parameter,
ψ
/v
decreases with time at all the stress levels. The correlation
between
ψ
/v and PF is negative at stress levels 20 and 50 kPa’s,


