3492
Proceedings of the 18
th
International Conference on Soil Mechanics and Geotechnical Engineering, Paris 2013
By contrast, silt, sand and gravel particles range from 0.002 mm
to 75 mm.
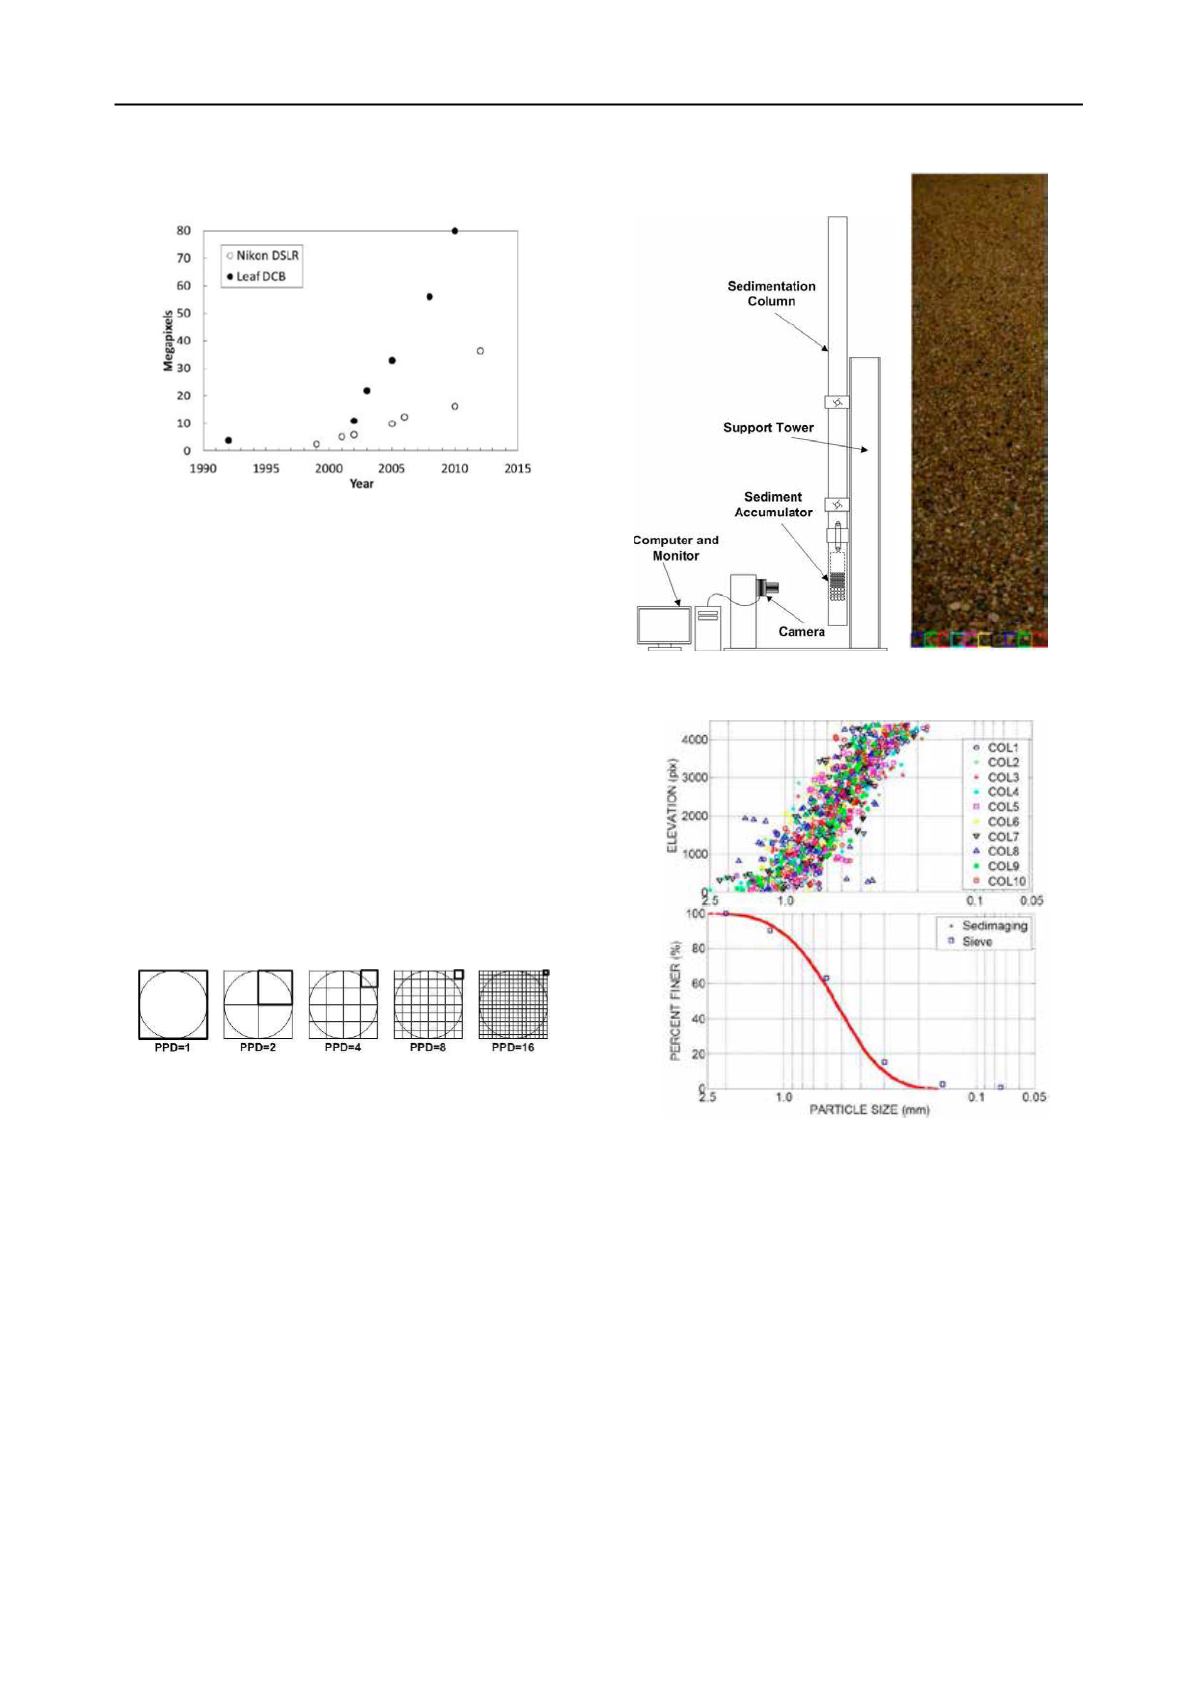
Figure 1. Advances in DSLR and DCB camera resolutions over time.
With pre-2010 lower resolution DSLR cameras, images had
to be taken at several magnifications to capture different particle
size ranges. Also, multiple images had to be taken at different
specimen locations and digitally “stitched” so that a combined
image would be a statistically valid representation of the soil. By
contrast, using a post-2010 higher resolution camera, a single
photo taken at a fixed magnification can produce particle size
distributions for soil particles ranging over 2 orders of
magnitude in diameter.
3 DIGITAL MEASURE OF PARTICLE SIZE
The size of any object in an image must be determined first in
digital pixel units. Conversion to actual dimensions then requires
knowledge of the camera & lens system magnification (i.e.
image scale). As such, the initial unit of measure for soil particle
size is
pixels per particle diameter
(
PPD
) where the diameter
corresponds to a square sieve opening as shown in Figure 2.
Shin and Hryciw (2004) and Jung (2010) calibrated various
image analysis methods against particle sizes as defined by
sieving using the
PPD
concept.
Figure 2. Pixels per Particle Diameter (
PPD
).
4 SEDIMAGING
The Sedimaging (short for sediment imaging) test currently
determines the size distribution for 2.0 mm to 0.075 mm soil
particles. The apparatus is shown in Figure 3. It consists of a 50
mm × 50 mm × 2000 mm water-filled column through which a
soil specimen is sedimented to segregate the particles by size. A
sediment accumulator at the bottom of the column contains glass
windows though which the soil is photographed following
sedimentation. Figure 3 also shows a typical sedimented soil.
A statistical method that correlates particle size via calibration
of a mathematical
wavelet index
to
PPD
was developed by Shin
and Hryciw (2004). The method requires that the particles in the
area of analysis be approximately the same size. Sedimentation
facilitates this. Following segregation of the specimen by
sedimentation, thousands of overlapping 128 pixel x 128 pixel
subareas, contained in ten vertical strips of the image, are
analyzed to produce the complete particle size distribution as
shown in Figure 4. Details about the test can be found in Hryciw
and Ohm (2012).
Figure 3. Sedimaging system and typical soil column (Ohm et al. 2012).
Figure 4. Typical Sedimaging result with comparison to sieving.
Based on Sedimaging tests of sands containing known
percentages of silt, the authors found that the minimum
PPD
that can be analyzed by the mathematical wavelet method is 2.7.
However, for simplicity this paper will round off and assume a
more conservative minimum
PPD
value of 3.0. To explain why
so few pixels are apparently needed to size the particles, it is
pointed out that the wavelet method does not determine the sizes
of every particle individually. It merely analyzes the overall
“texture” in each 128 pixel x 128 pixel analysis subarea. As
such, it is referred to as a
statistical
method.
5 TRANSLUCENT SEGREGATION TABLE (TST)
A back-lit Translucent Segregation Table (TST) shown in Figure
5 determines size distribution for particles between 75 mm and 2
mm. Whereas a
statistical
image analysis method is used in
Sedimaging, the TST utilizes a
deterministic
image analysis
approach. A deterministic method counts the actual number of
image pixels occupied by each particle. The shape and aspect
ratio of each particle can also be determined. For each particle to
be individually sized, each must be clearly visible in the image.
If small particles are in the vicinity of much larger particles, they


