 
          2749
        
        
          Technical Committee 212 /


            Comité technique 212


          Figure 5. Increment stiffness plot of records from Levels 1 to 3,
        
        
          Pile TP02
        
        
          1.3


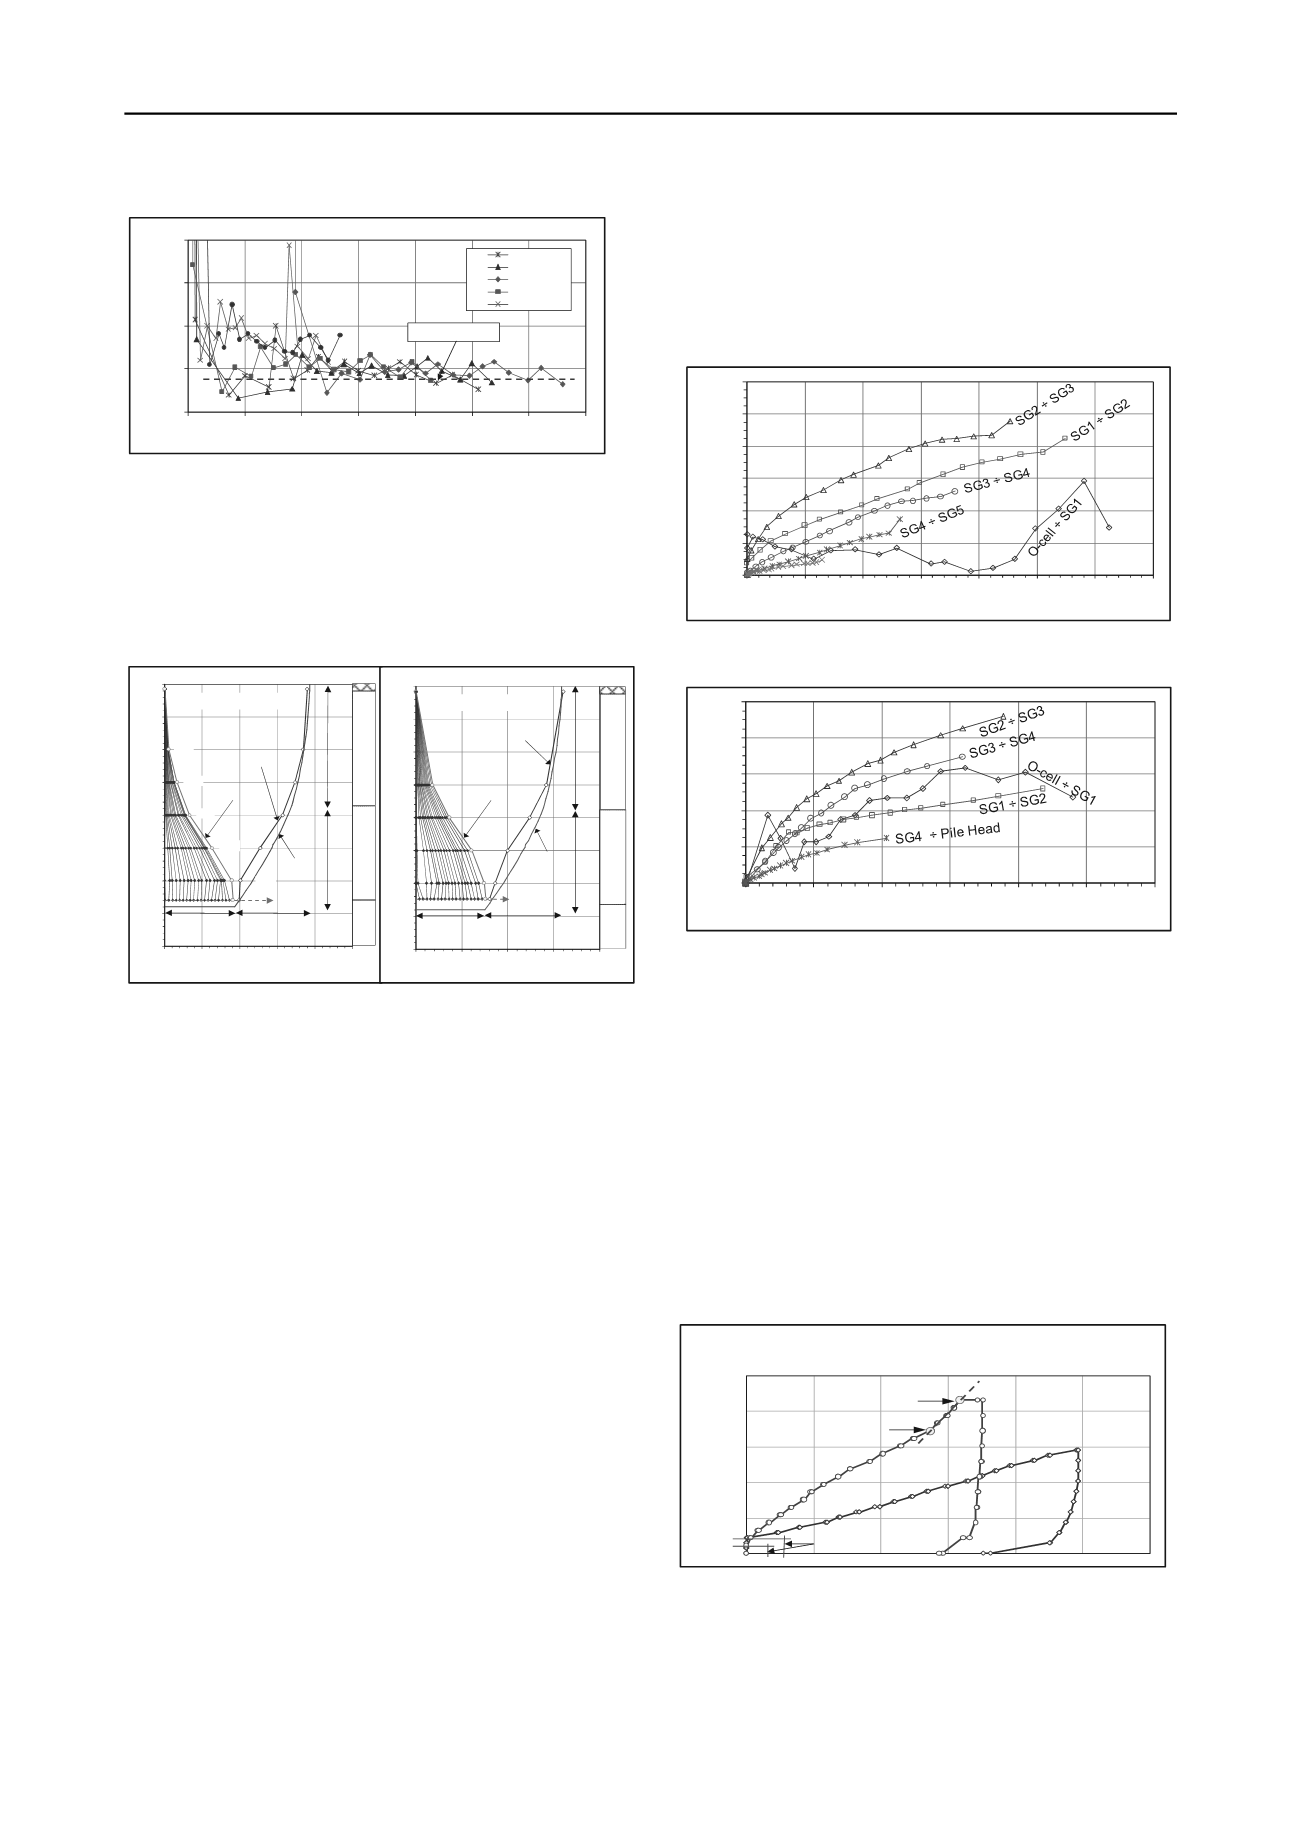
            Load distribution along the pile shafts


          The evaluated stiffness (EA) values were used to convert the
        
        
          strain measurements to load. Figure 6 shows the so-evaluated
        
        
          load distributions. The shaft resistances shown along the upper
        
        
          about 30 m for both piles were not fully mobilized.
        
        
          Figure 6. Load Distributions with Approximate Head-down
        
        
          Curve of Piles TP01 and TP02
        
        
          As shown in Figure 1, the soil at the depth of SG1 to SG3
        
        
          was a firm clay layer.  It is a reasonable expectation that the
        
        
          load distributions would have shown a gentle shape with a
        
        
          decreasing slope toward depth, reflecting increasing shaft
        
        
          resistance as SPT N-indices increase with depth.  That this is
        
        
          not the case is considered due to varying effect of the slurry
        
        
          filter cake and, possibly varying pile cross section.
        
        
          Assuming that the shaft resistance would show a uniform
        
        
          proportionality to effective overburden stress, Figure 6 shows
        
        
          the actual and approximate equivalent head-down load-
        
        
          distribution curves. The latter are obtained by an effective stress
        
        
          calculation for ß-coefficient of 0.2 to 18.5 m depth and 0.3
        
        
          below this depth to the pile toes. The effective stress analysis
        
        
          indicates the toe resistance and total shaft resistance of Pile
        
        
          TP01 are 3,723 and 4,088 KN, and of Pile TP02 are 4,495 KN
        
        
          and 4,932 KN, respectively.
        
        
          1.4


            Unit stress versus movement for shaft resistances and pile


            toes


          The average unit shaft shear resistance between the gage levels
        
        
          can be determined as the difference in evaluated strain-gage
        
        
          load divided by the surface area between the gage levels.
        
        
          Figures 8 and 9 show those values plotted against movements
        
        
          for the particular gage levels. The maximum values of the unit
        
        
          shaft resistance evaluated between the O-cell and SG1 for both
        
        
          test piles showed the average unit shaft resistances of about
        
        
          60 kPa.  Because of strain-softening, the shear resistances were
        
        
          smaller than expected. Moreover, the resistances from SG1
        
        
          through SG3 are smaller than between SG2 and SG3 for both
        
        
          piles.. It is probable that the construction process left a filter
        
        
          cake between the concrete and the soil and, therefore, the shear
        
        
          movement occurred in the filter cake. The curves also show
        
        
          that, for both piles, ultimate shaft resistance along the length
        
        
          above the O-cell level has not occurred excepting for the curves
        
        
          from O-cell to SG1. The uppermost gage level movements and
        
        
          loads were too small to produce meaningful curves in pile. The
        
        
          records of unit shear resistance between SG4 and SG5 in Pile
        
        
          TP02 were unreliable and are therefore omitted.
        
        
          0
        
        
          20
        
        
          40
        
        
          60
        
        
          80
        
        
          0
        
        
          50
        
        
          100
        
        
          150
        
        
          200
        
        
          250
        
        
          300
        
        
          350
        
        
          SG - 1A
        
        
          SG - 1B
        
        
          SG - 2A
        
        
          SG - 2B
        
        
          SG - 3A


            INCREMENTAL STIFFNESS AE (GN)


            STRAIN(μS)


            AE = 17 (GN)


          Figure 8. Average shear resistance between gage levels of Pile
        
        
          TP01
        
        
          0
        
        
          20
        
        
          40
        
        
          60
        
        
          80
        
        
          100
        
        
          120
        
        
          0.0
        
        
          0.5
        
        
          1.0
        
        
          1.5
        
        
          2.0
        
        
          2.5
        
        
          3.0
        
        
          3.5


            MOVEMENT (mm)


            AVERAGE SHEAR (KPa)


          SG5 ÷ Pile Head
        
        
          0
        
        
          5
        
        
          10
        
        
          15
        
        
          20
        
        
          25
        
        
          30
        
        
          35
        
        
          40
        
        
          0 2,000 4,000 6,000 8,000 10,000


            LOAD(KN)


            DEPTH (m)


          Measured
        
        
          Distributio
        
        
          n
        
        
          Figure 9. Average shear resistance between gage levels of Pile
        
        
          TP02
        
        
          Figure 10 shows stresses applied to the pile toe versus the
        
        
          pile toe movements divided by the pile diameter in percent. The
        
        
          stresses are determined by dividing the measured load at O-cells
        
        
          with the nominal shaft areas below O-cell. The maximum toe
        
        
          movements were about 3 and 5 mm, respectively. The
        
        
          increasing stiffness measured for Pile TP01 is considered due to
        
        
          the debris at the pile toe having become compressed.
        
        
          For both piles, the pile toe stress-movement response was
        
        
          essentially linear and showed no tendency toward an ultimate
        
        
          resistance. It is obvious that the pile toe response is not
        
        
          representative for pile toes placed in weathered sandstone or in
        
        
          sand.  Similar observation for large diameter bored piles is
        
        
          reported by (Fellenius and Nguyen 2013).
        
        
          Figure 10. Stress-% downward movement curve of Piles TP01
        
        
          and TP02
        
        
          1.5


            Back-analysis to response long-term settlements of piles


          The back-analysis of two tested piles was performed by “The
        
        
          Unified Pile Design” method (Fellenius 1984; 1988; 2011).


            O-cell


            #4


            #3


            #2


            #1


            #5


          SILTY
        
        
          SAND
        
        
          FIRM
        
        
          CLAY
        
        
          SAND
        
        
          STONE
        
        
          ExistingGroundSurface


            Rt= 3,723KN Rs= 4,088KN


            TP01 (D800)


          Equivalent
        
        
          Head-down
        
        
          Distribution
        
        
          Approximate
        
        
          Head-down
        
        
          Distribution
        
        
          0
        
        
          5
        
        
          10
        
        
          15
        
        
          20
        
        
          25
        
        
          30
        
        
          35
        
        
          40
        
        
          0
        
        
          3,000 6,000 9,000 12,000


            LOAD(KN)


            DEPTH (m)


          0
        
        
          20
        
        
          40
        
        
          60
        
        
          80
        
        
          100
        
        
          0.0
        
        
          1.5
        
        
          3.0
        
        
          4.5
        
        
          6.0
        
        
          7.5
        
        
          9.0


            MOVEMENT (mm)


            AVERAGE SHEAR (KPa)


            O-cell


          ExistingGroundSurface
        
        
          SILTY
        
        
          SAND


            #4


            #3


            #2


            #1


          FIRM
        
        
          CLAY
        
        
          SAND
        
        
          STONE


            #5


          Measured
        
        
          Distribution


            TP02 (D1000)


          Equivalent
        
        
          Head-down
        
        
          Distribution


            Rt= 4,495KN


          Approximate
        
        
          Head-down
        
        
          Distribution


            Rs= 4,932KN


          0.0
        
        
          0.5
        
        
          1.0
        
        
          1.5
        
        
          2.0
        
        
          2.5
        
        
          0
        
        
          1
        
        
          2
        
        
          3
        
        
          4
        
        
          5
        
        
          6


            MOVEMENT/DIAMETER  (%)


            TP01-D800


            TP02-D1000


            NORMALIZED TOE STRESS (MPa)


          Breaking Bonds