 
          2748
        
        
          Proceedings of the 18
        
        
          th
        
        
          International Conference on Soil Mechanics and Geotechnical Engineering, Paris 2013
        
        
          3 PILE CONSTRUCTION AND TEST PROGRAMME
        
        
          The two test piles, Piles TP01 and TP02 of 800 and 1,000 mm
        
        
          diameter, were constructed using bucket drill technique with
        
        
          bentonite slurry on 24 and 26 August 2012, to 34 m depth,
        
        
          respectively. The production piles were designed with the
        
        
          reinforcing cages of sixteen 20 and 22 mm bars to 11 m depth
        
        
          and eight 20 and 22 mm bars below this depth. The O-cells
        
        
          attached at 0.5 and 0.8 m above the pile toes, as shown in
        
        
          Figure 2. However, to avoid damage to the instrumentation
        
        
          during the lowering the reinforcing cages into piles the
        
        
          reinforcing cages of the test piles were supplied with sixteen
        
        
          bars.
        
        
          Figure 2. Details of instrumented test piles
        
        
          The test piles were instrumented with a pair of diametrically
        
        
          opposed vibrating wire strain-gages at four levels and two pairs
        
        
          of diametrically opposed vibrating wire strain-gages at levels
        
        
          SG1 and SG4, respectively.
        
        
          The test piles were constructed by first inserting 820 mm and
        
        
          1,020 mm outer diameter temporary casings, respectively,
        
        
          to 7.6 m depth.  Thereafter, the test piles were drilled to 34 m
        
        
          depth using a bucket drill with bentonite slurry. Before
        
        
          concreting each shaft, the shafts were cleaned and a reinforcing
        
        
          cage with the O-Cell assembly was lowered into the shafts.  The
        
        
          O-cell assemblies consisted of three O-cells; 200 mm diameter
        
        
          in Pile TP01 and 220 mm in TP02.
        
        
          On completion of the drilling, on August 24 and 26, 2012,
        
        
          a 219 mm diameter tremie pipe was inserted to the bottom of
        
        
          each shaft and tremie placing of the concrete was commenced,
        
        
          displacing the bentonite slurry.
        
        
          The concrete cube strength was determined 28 days after
        
        
          casting to 40 MPa and 44 MPa for the concrete used in Piles
        
        
          TP01 and TP02, respectively.
        
        
          The bottom 0.5 and 0.8 m length of Piles TP01 and TP02,
        
        
          respectively, was equipped with a 114 mm diameter coring tube
        
        
          attached to the reinforcing cage. The coring was performed after
        
        
          the concrete had cured and showed that an about 20 mm thick
        
        
          layer of debris and slurry existed below the toe of Pile TP01.
        
        
          Pile TP02 could not be cored because the coring tube was
        
        
          obstructed by steel reinforcement bars..
        
        
          The static loading tests were performed on September 16 and
        
        
          17, 2012, 23 and 22 days after concreting.
        
        
          4 TEST RESULTS AND ANALYSIS
        
        
          1.1


            Load – movement measurements


          The internal bond of the O-cells was broken at loads of at 190
        
        
          and 480 KN load for Piles TP01 and TP02, respectively.
        
        
          Theoretically, the O-Cell does not impose an additional upward
        
        
          load until its expansion force exceeds the bond breaking load,
        
        
          the buoyant weight of the pile above the O-Cell and the residual
        
        
          load, if any, acting at the O-cell level.  For both test piles TP01
        
        
          and TP02, the initial upward movement records were taken at
        
        
          570 and 960 KN; that is, these recorded loads included bond
        
        
          breaking load, the buoyant weight and residual load. The pile
        
        
          buoyant weights above the O-Cell for Piles TP01 and TP02
        
        
          were 163 KN and 255 KN, respectively.  Therefore, the residual
        
        
          loads determined at O-cell locations of Piles TP01 and TP02 are
        
        
          217 and 225 KN, respectively.
        
        
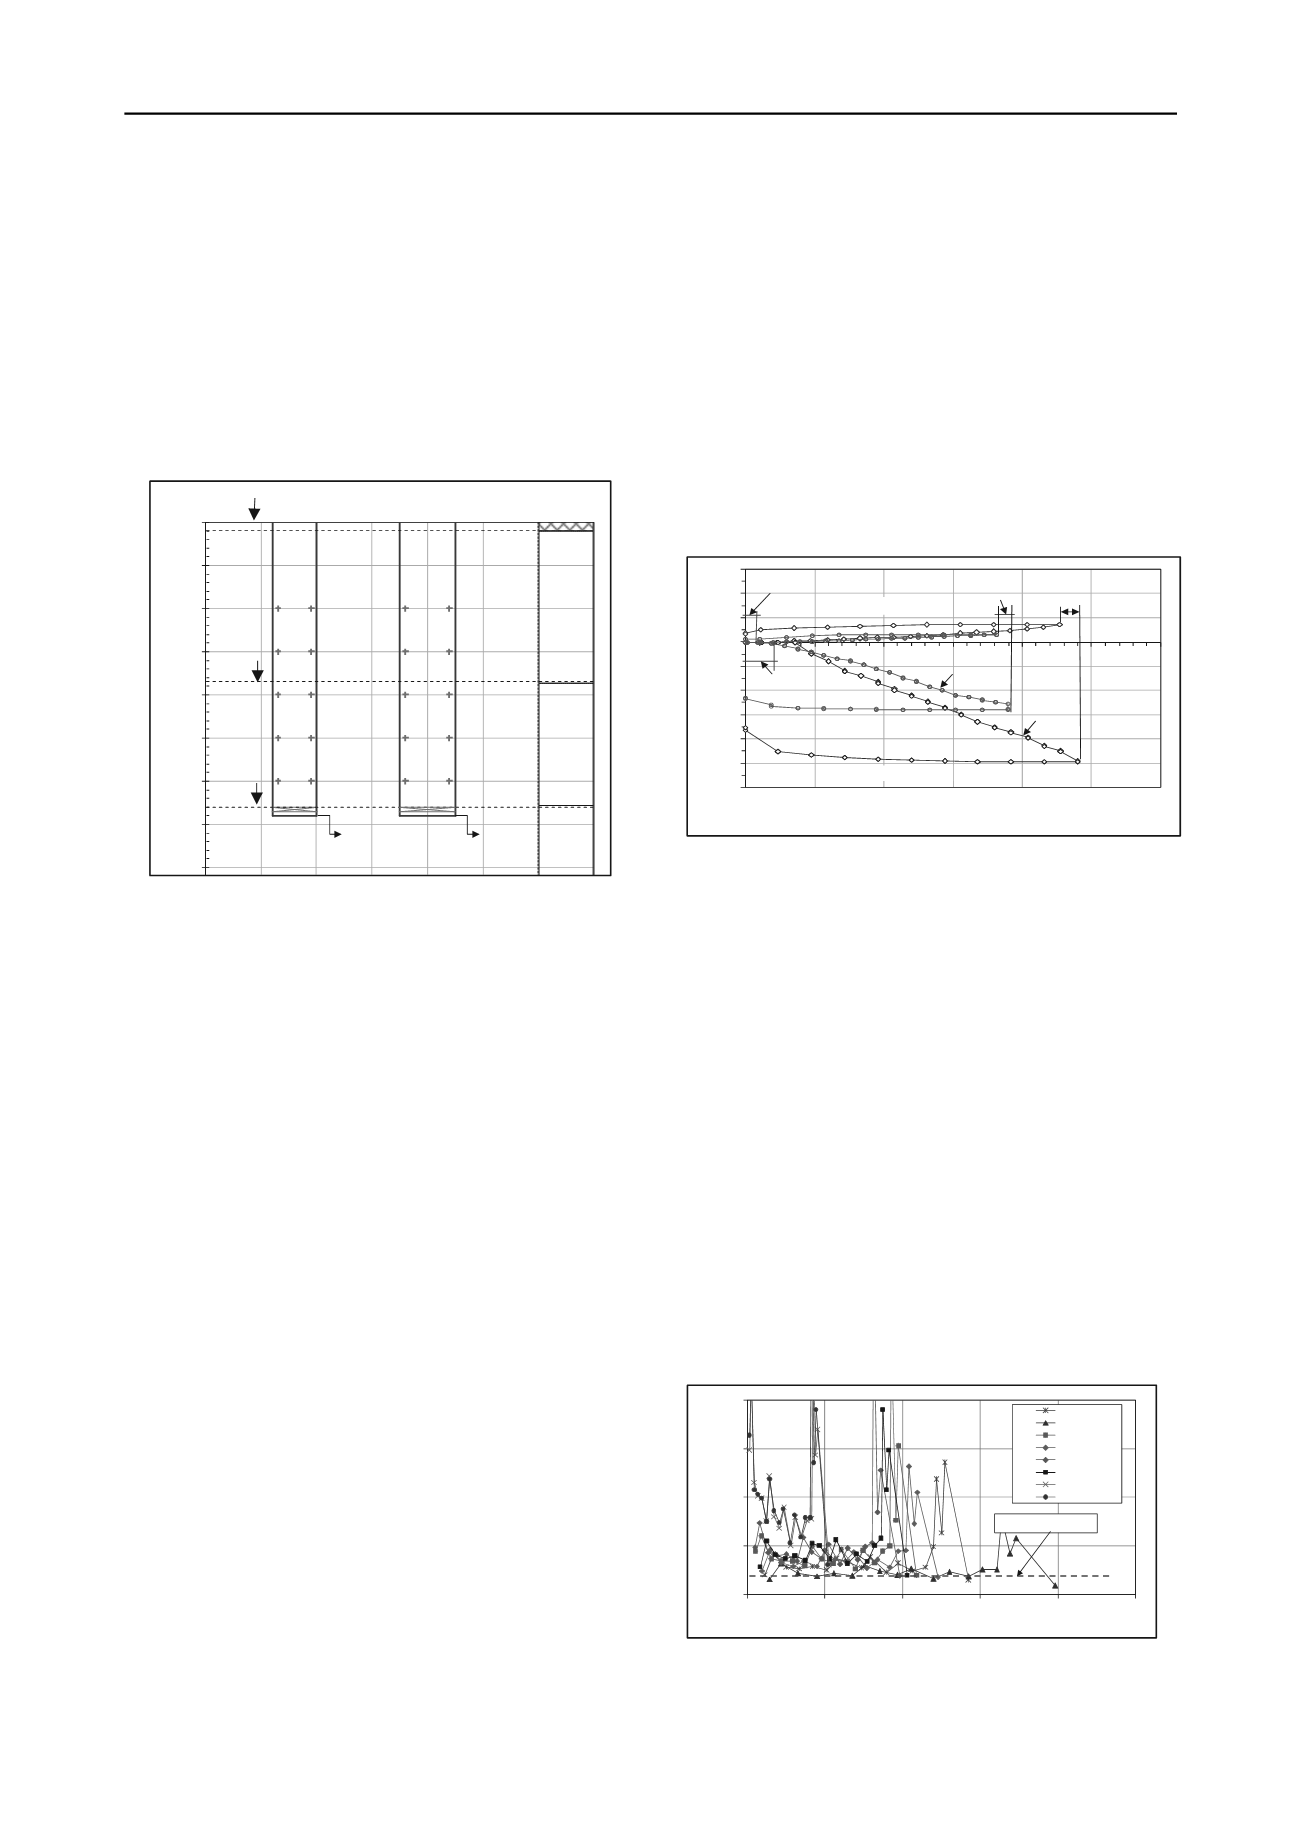
          Figure 3 shows the load-movement records of the two O-cell
        
        
          tests. After subtracting the buoyant weight of the piles TP01 and
        
        
          TP02 above the O-Cell, the maximum upward resistances were
        
        
          3,636 and 4,544 KN, respectively. The maximum O-cell upward
        
        
          movements were 3.3 mm and 7.4 mm, the maximum O-cell
        
        
          downward movements were 28.0 and 49.3 mm, and the
        
        
          maximum pile head movements (upward) were 0.2 and 2.5 mm,
        
        
          respectively.
        
        
          0
        
        
          5
        
        
          10
        
        
          15
        
        
          20
        
        
          25
        
        
          30
        
        
          35
        
        
          40


            O-Cell


            Pile TP01


            D800


          18.5 m
        
        
          33 m
        
        
          0.0 m


            DEPTH (m)


          Ground Surface
        
        
          15 m
        
        
          20 m
        
        
          25 m
        
        
          30 m
        
        
          10 m
        
        
          33.2 m
        
        
          SILTY
        
        
          SAND
        
        
          FIRM
        
        
          CLAY
        
        
          SAND
        
        
          STONE
        
        
          SG1
        
        
          SG2
        
        
          SG3
        
        
          SG4
        
        
          SG5
        
        
          SG1
        
        
          SG2
        
        
          SG3
        
        
          SG4
        
        
          SG5


            Pile TP02


            D1000


          15 m
        
        
          20 m
        
        
          25 m
        
        
          30 m
        
        
          10 m
        
        
          33.5 m


            O-Cell


          34 m
        
        
          34 m
        
        
          -60
        
        
          -50
        
        
          -40
        
        
          -30
        
        
          -20
        
        
          -10
        
        
          0
        
        
          10
        
        
          20
        
        
          30
        
        
          0
        
        
          1000 2000 3000 4000 5000 6000


            MOVEMENT  (mm)


            LOAD  (KN)


          Buoyant Weight
        
        
          255 KN


            UPWARD


            DOWNWARD


          Buoyant Weight
        
        
          163 KN


            TP02


            TP01


          Breaking Bond
        
        
          TP01-190 KN
        
        
          Breaking Bond
        
        
          TP02-480 KN
        
        
          Figure 3. Load-movement curves of the piles
        
        
          1.2


            Strain measurements and determining Axial Modulus


          To determine the secant modulus of the pile material, the best
        
        
          way is to use "tangent modulus" or "incremental stiffness" plot
        
        
          which is the applied increment of load over the induced
        
        
          increment of strain plotted versus the measured strain.  The
        
        
          tangent modulus is then converted to the secant modulus
        
        
          (Fellenius 1989; 2011).  The incremental stiffness plots for the
        
        
          two tests are shown in Figures 4 and 5.  The incremental
        
        
          stiffness method assumes that for load increments applied after
        
        
          the shaft resistance at the studied gage level has been fully
        
        
          mobilized, the continued incremental stiffness values will plot
        
        
          along a slightly sloping line, representing the tangent modulus
        
        
          relation for the pile cross section.  Because of the combined
        
        
          effect of the strain-softening and the scatter of values, the
        
        
          incremental stiffness method did not provide sufficiently precise
        
        
          values for the tangent and secant stiffnesses.  Therefore, for this
        
        
          case, the authors have preferred to rely on the linear portions of
        
        
          load-strain relations and convert the measured strains using
        
        
          constant stiffnesses, AE, of 12.5 GN and 17.0 GN for Piles
        
        
          TP01 and TP02, respectively.  Correlated to the nominal cross
        
        
          sectional areas, the values indicate that the E-modulus of Piles
        
        
          TP01 and TP02 is about 25 and 22 GPa, respectively.
        
        
          0
        
        
          20
        
        
          40
        
        
          60
        
        
          80
        
        
          0
        
        
          100
        
        
          200
        
        
          300
        
        
          400
        
        
          500
        
        
          SG - 1A
        
        
          SG - 1B
        
        
          SG - 1C
        
        
          SG - 1D
        
        
          SG - 2A
        
        
          SG - 2B
        
        
          SG - 3A
        
        
          SG - 3B


            INCREMENTAL STIFFNESS AE


            (GN)


            STRAIN (μS)


            AE = 12.5 (GN)


          Figure 5. Increment stiffness plot of records from Levels 1 to 3,
        
        
          Pile TP01