3373
Technical Committee 307 + 212 /
Comité technique 307 + 212
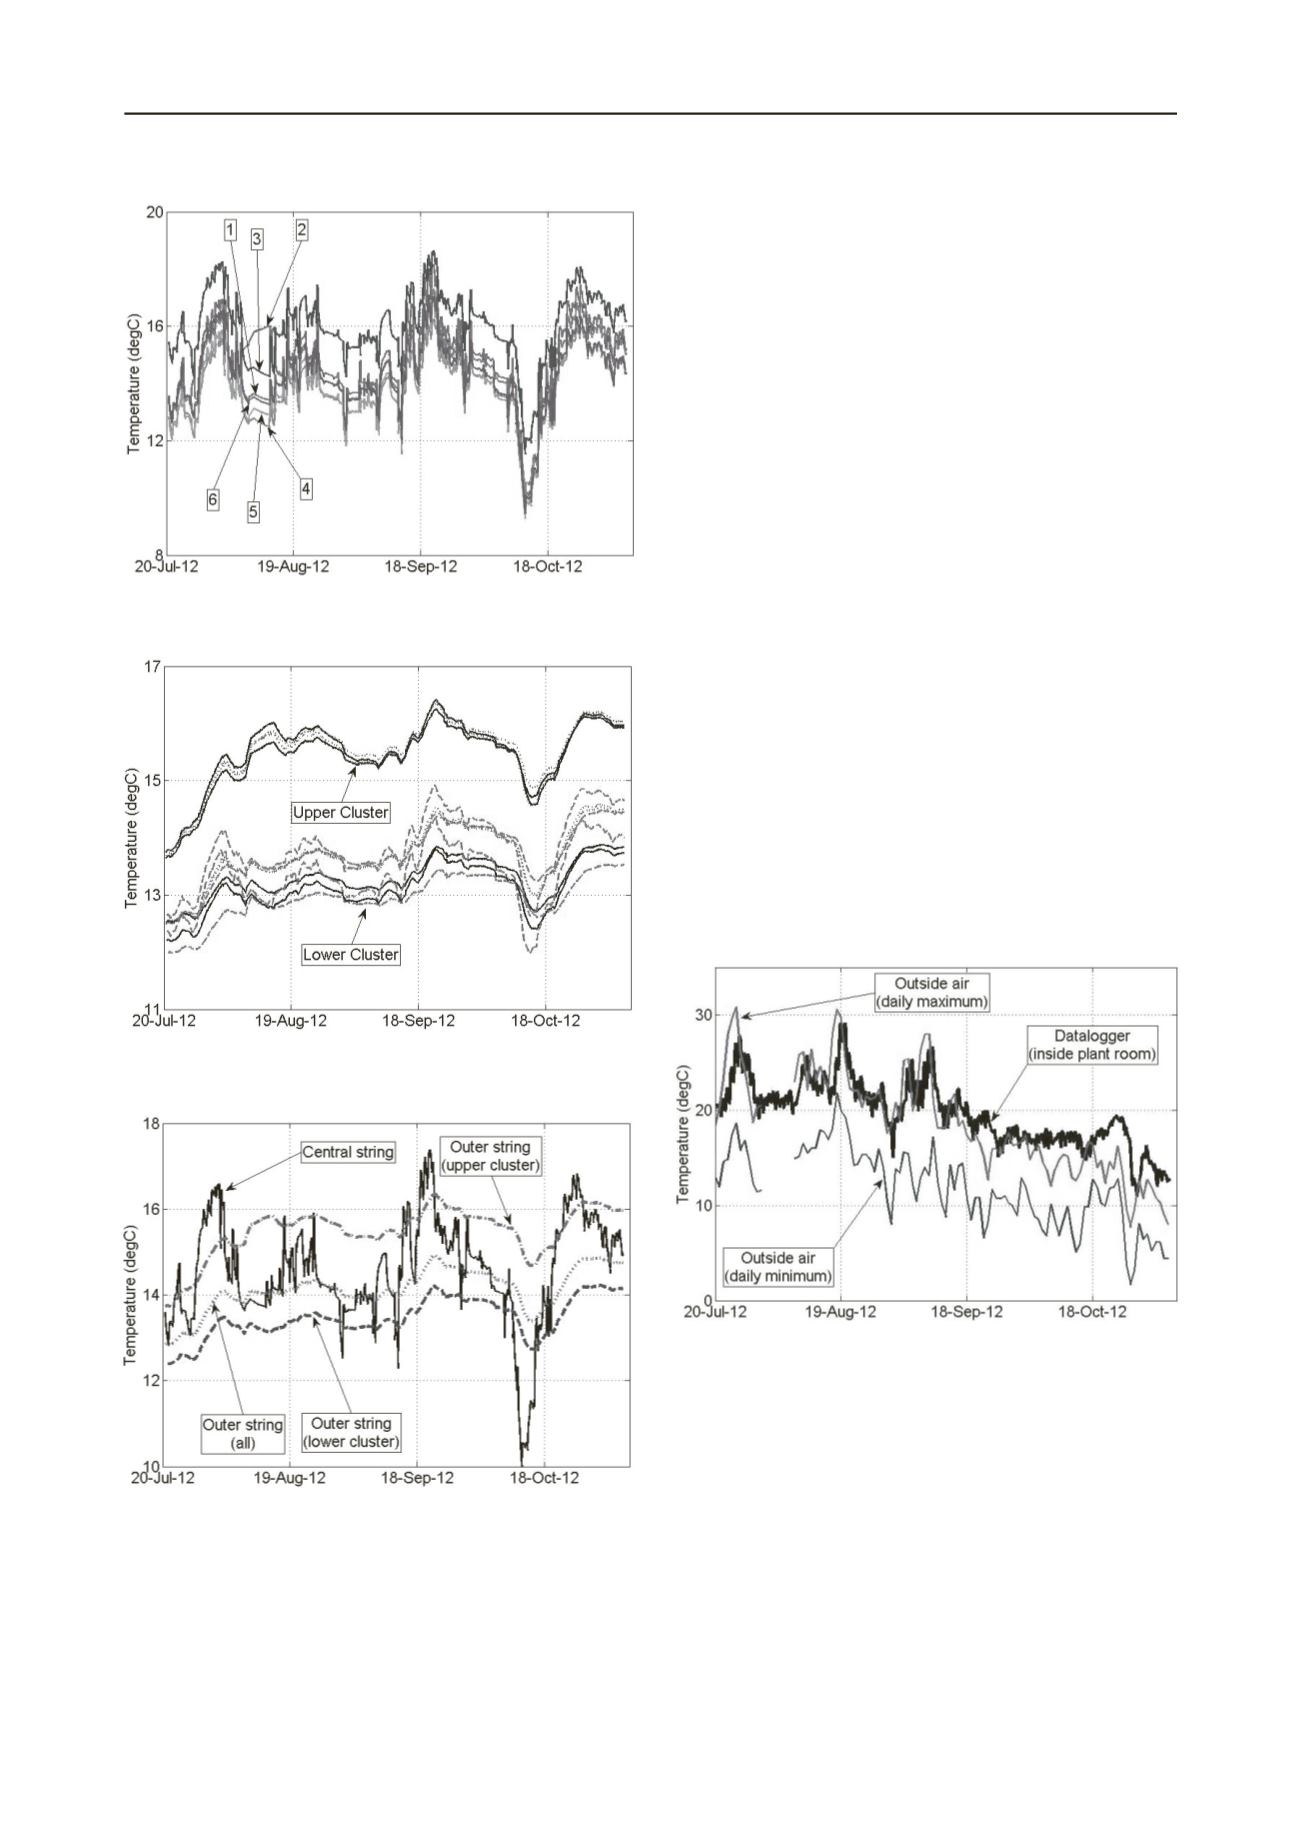
Figure 4. Operational temperatures from the central thermistor string
(numbers refer to thermistor string levels).
Figure 5. Operational temperatures from the outer thermistor string
(dashed = thermistor level 1; solid = level 2; dotted = level 3).
Figure 6. Mean thermistor string temperatures.
4 INITIAL RESULTS
Following collection of the background data it was necessary,
due to construction constraints, to disconnect the datalogger
until shortly after the Crystal was first occupied. Since
collection of data recommenced we now have almost four
months of temperature information for the pile under
operational conditions.
Figure 4 and 5 present the temperature data from the central
thermistor string and the outer thermister strings respectively.
The central thermistor string records a greater range of
temperatures than the outer strings, with ±4
o
C and ±1
o
C
variation from the initial ground temperatures respectively. The
central string also shows greater short term variation compared
with the outer strings. This is because the temperature change of
the central thermistors will closely follow that of the heat
transfer fluid circulating within the U-tubes. However, by the
time heat flow from the fluid reaches the outer thermistor
strings any very short term variations will have smoothed out.
It is also noted that the outer thermistor readings are grouped
into two distinct clusters. The upper cluster is approximately
2
o
C warmer than the lower cluster, but follows a similar,
although not identical trend. If both the U-tubes and steel cage
were installed exactly centrally within the pile bore then,
ignoring pile end effects and any variation in ground and
concrete thermal properties, all the outer thermistors should
read the same value. However, since an exactly central
installation is not possible, it should be expected that there will
be some variation in these values. However, what is surprising
is that the upper cluster contains level 2 and level 3 thermistors
from opposite sides of the pile, which should only have close to
equal values if the cage and the pipes have been installed
centrally. This could suggest that the readings in the upper
cluster are erroneous.
This view is supported by looking at the average
temperatures for the central and outer strings (Figure 6).
Temperatures are generally rising with time as heat is rejected
to the ground via the pile. Therefore the temperatures closer to
the pile edge would be expected to be lower than those in the
centre next to the pipes. In this context the upper cluster appears
to be erroneously high, while the lower cluster shows
temperatures in a more realistic range.
Figure 7. London air temperatures.
The general trend of increasing temperatures, despite the
advent of cooler air temperatures as the autumn progressed
(Figure 7) is a reflection of the complexity of both modern
buildings and the heating-ventilation-air conditioning (HVAC)
system in this building in particular. For a system where pile
heat exchangers are either providing all of buildings heating and
cooling demands, or covering only partial demand in
combination with a traditional HVAC system, then the pile
temperature would be expected to reflect the outside air
temperatures and decrease throughout the winter months.
However, in this case the energy needs of the building are being
met by a combination of the pile heat exchangers, the borehole
heat exchangers and a solar system. These means that the three
components will be operated together to achieve the building
heating and cooling demands and, for example, on some


