3369
Technical Committee 307 + 212 /
Comité technique 307 + 212
0
5
10
15
20
25
30
1.5 1.6 1.7 1.8 1.9 2.0
Maximum swelling strain,
smax
(%)
Initial dry density,
d0
(Mg/m
3
)
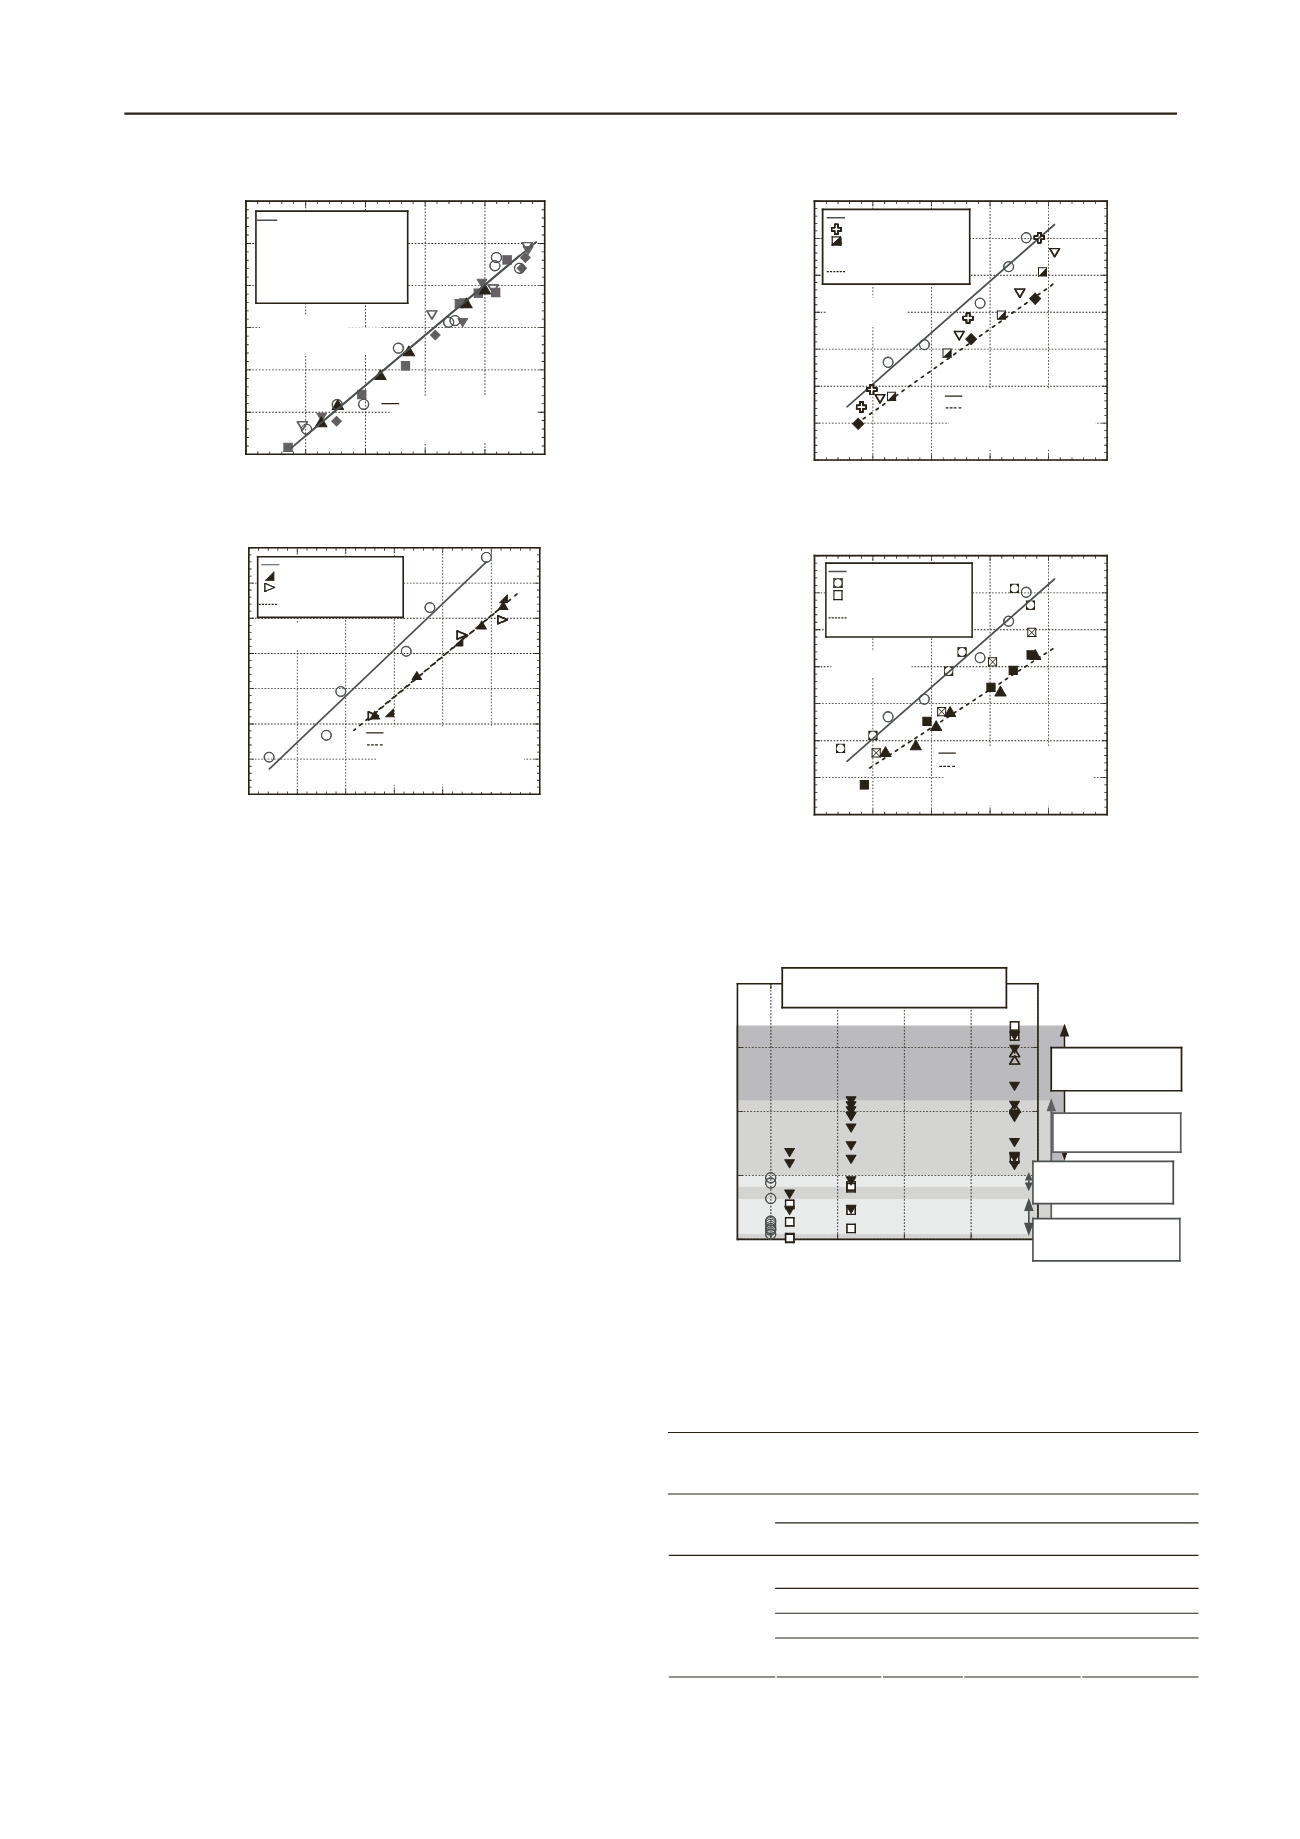
v
=1000 kPa
○
: No heating
▽
: 110 degree, 28 days
◆
: 130 degree, 28 days
▼
: 110 degree, 120 days
■
: 130 degree, 120 days
▲
: 130 degree, 365 days
:y=59.729x-93.373
y: Maximum swelling strain (%)
x: Initial dry density (Mg/m
3
)
(a) Vertical stress = 1000 kPa
0
5
10
15
20
25
30
35
1.4 1.5 1.6 1.7 1.8 1.9 2.0
Maximum swelling strain,
smax
(%)
Initial dry density,
d0
(Mg/m
3
)
v
=500kPa
○
: No heating
: 90 degree, 365 days
: 110 degree, 365 days
▲
: 130 degree, 365 days
: y=65.657x-91.099
: y=57.785x-84.449
y : Maximum swelling strain (%)
x : Initial dry denisty (Mg/m
3
)
(b) Vertical stress = 500 kPa
Figure 4.Maximum swelling strain and initial dry density of sodium-
type bentonite A with vertical stressof 1000 kPa and 500 kPa.
0
5
10
15
20
25
30
35
1.2 1.3 1.4 1.5 1.6 1.
Maximum swelling strain,
smax
(%)
Initial dry density,
d0
(Mg/m
3
)
7
v
=1000kPa
○
: No heating
: 60 degree, 28 days
: 90 degree, 28 days
▽
: 110 degree, 28 days
◆
: 130 degree, 28 days
: y=69.714x-80.407
: y=56.325x-66.728
y : Maximum swelling strain (%)
x : Initial dry density (Mg/m
3
)
(a) Heating duration 28 days
0
5
10
15
20
25
30
35
1.2 1.3 1.4 1.5 1.6 1.
Maximum swelling strain,
smax
(%)
Initial dry density,
d0
(Mg/m
3
)
7
v
=1000kPa
: y=69.714x-80.407
: y=51.196x-59.911
y : Maximum swelling strain (%)
x : Initial dry density (Mg/m
3
)
○
: No heating
:
60 degree, 120 days
: 90 degree, 120 days
■
: 130 degree, 120 days
▲
: 130 degree, 365 days
×
(b) Heating duration 120 days and 365 days
Figure 5. Relationbetween maximum swelling strain and initial dry
density of calcium-type bentonite C at vertical stress of 1000 kPa.
characteristics of sodium-type bentonite are strongly reduced by
thermal exposure at 9.8–10.0 kPa vertical stress.
Figure 5 showsthe relationbetween maximum swelling strain
and initial dry density of calcium-type bentonite C at vertical
stress of 1000 kPa. By comparing results presented in Fig. 5
with those in Fig. 4, the swellingdeformation characteristics of
calcium-type bentonite C aremarkedlyreduced by thermal
exposure at vertical stress of 1000 kPa. The
swellingdeformation characteristics of calcium-type bentonite C
are strongly reduced byheating temperatures greater than
90°Cfor all heating durations. Furthermore, the reduction ratio
of maximum swelling strain attributable tothermal
exposureincreases along with theinitial dry density.
4 THERMAL INFLUENCEON BENTONITESSHOWN
BYCHEMICAL ANALYSIS RESULTS
Figure 6 presents sodium ion concentrations of water measured
around the compacted specimen of sodium-type bentonite A
after swelling deformation tests. This figure shows the
relationbetween sodium ion concentration and heating duration
with parameters of heating temperature and vertical stress.
0
5
10
15
20
0
100 200 300
Ion concentration of Na
+
(mol/m
3
)
Heating duration (day)
○
: No heating
△
: 90 degree
□
: 110 degree
▼
: 130 degree
6.39 - 16.70mol/m
3
(500 kPa, Heating)
4.39 - 4.83mol/m
3
(500 kPa, No heating)
0.09 - 10.83mol/m
3
(1000 kPa, Heating)
0.41 - 3.21mol/m
3
(1000 kPa, No heating)
Figure 6. Results of sodium ion concentration of water around the
compacted specimens of bentonite A after swellingdeformation tests.
Results depicted in Fig. 6 show thatthe sodium-ion
concentration of water around the specimen is increasedby
thermal exposure for sodium-type bentonite A. Especiallyfor
higher heating temperatures and longer heating durations, the
sodium-ion concentration of water around the specimen is
higher. Moreover, Fig. 6 depicts that the sodium-ion
concentration in water around the specimen at 500 kPa of
vertical stress is greater than that at 1000 kPa of vertical stress.
The measured results of calcium ion concentration are thesame
results of sodium ion concentration. Those results show that
exchangeable cations such as Na
+
, Ca
2+
are apt to elute to
surrounding water around the bentonite specimen for the
sodium-type bentonite A.In contrast, Table 2 presents results for
calcium-type bentonite C which show thatthe sodium and
calcium ionconcentrations are almost unchanged irrespective of
thermal exposure. Therefore, the thermal influence on calcium-
type bentonite differs from that on sodium-type bentonite.
Table 2. Results of sodium and calcium ions concentrations of water
around calcium-type bentonite C after swelling pressure and swelling
eformation tests.
d
Experiment
Heating
temperatur
e (°C)
Heating
duratio
n (day)
Na
+
ion
concentratio
n (mol/m
3
)
Ca
2+
ion
concentratio
n (mol/m
3
)
No heating
0.33–1.65
0.01–0.16
Swelling
pressure
test
130
28– 120
0.20–0.46
0.00–0.14
No heating
0.21–0.59
0.05–0.48
90–130
28
0.03–1.27
0.01–0.45
90–130
120
0.06–0.84
0.17–0.27
Swelling
deformatio
n test at
1000 kPa
vertical
stress
130
365
0.50–0.78
0.12–0.25


