3376
Proceedings of the 18
th
International Conference on Soil Mechanics and Geotechnical Engineering, Paris 2013
Figure 1. TP02 probe (Hukseflux, 2003).
2.2
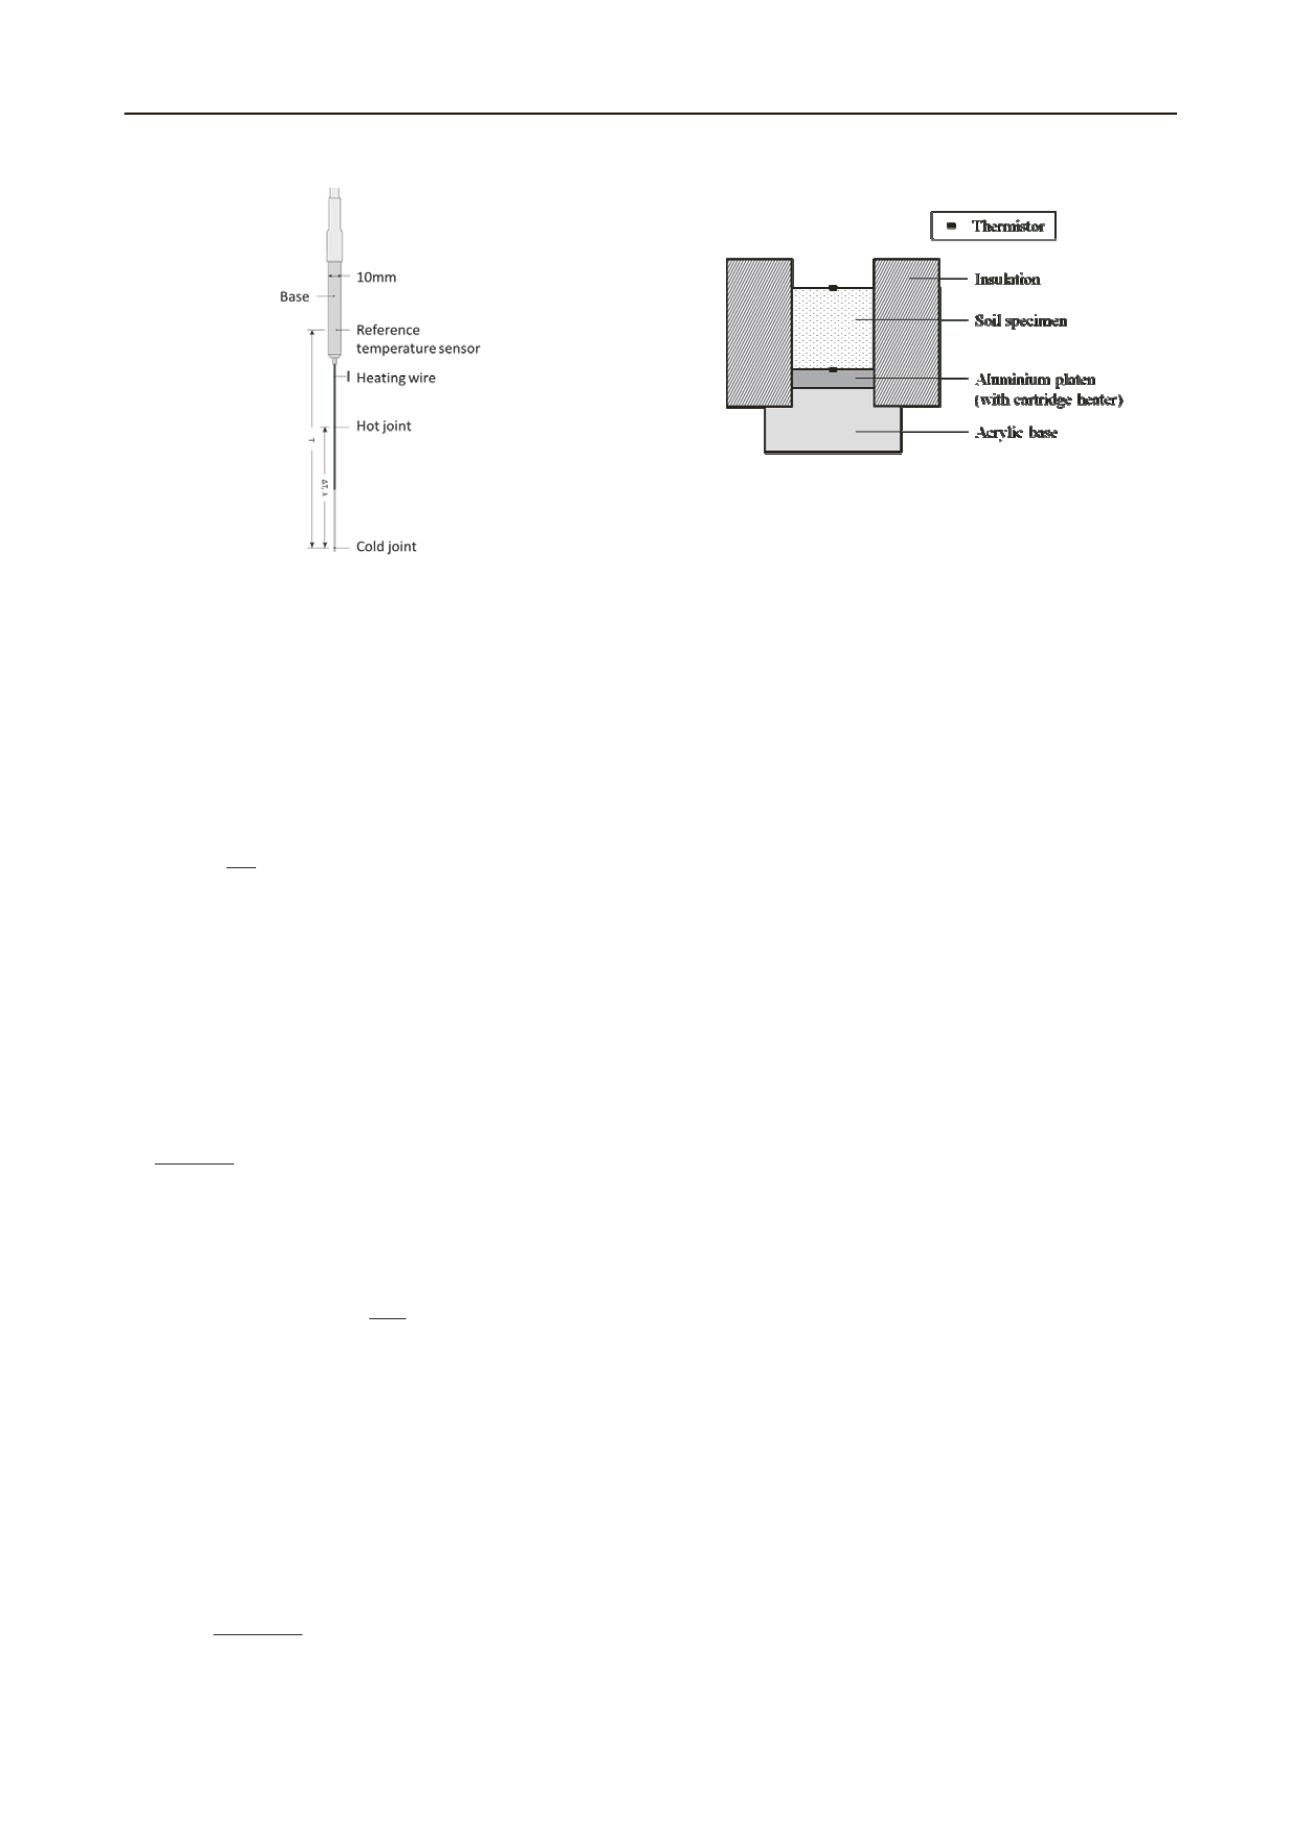
Thermal cell
The thermal cell design was loosely based on Clarke et al.
(2008). A diagram of the apparatus is shown in Figure 2. The
thermal conductivity of a cylinder of soil is measured by
generating one-directional heat flow along the axis of the
specimen. The heat is generated by a cartridge heater embedded
in the aluminium platen. Provided the specimen is well
insulated so that radial heat losses can be neglected, the heat
flow through the specimen during steady state is governed by
Fourier’s Law of heat conduction:
L
TA Q
(5)
where
Q
is the power input,
A
is the cross-sectional area, Δ
T
is the temperature difference across the length of the specimen,
and
L
is the length of the specimen. If
Q
cannot be accurately
determined, measurement of the temperatures in the specimen
as it cools after the power is switched off (the recovery phase)
can be used to determine the heat transfer coefficient between
the top of the soil and the air and hence the power. This uses the
lumped capacitance method, which is valid when the
temperature difference across the soil is small compared with
the temperature difference between the soil surface and the
ambient temperature (Incropera et al., 2007):
1.0
amb
top
top
base
T T
T T
(6)
where subscripts
base
,
top
and
amb
refer to temperature at
the base of the soil, top of the soil, and of the ambient air
respectively. Where this is satisfied, the temperature of the soil
at time
t
is (Clarke et al., 2008):
t
mc
hA
T T TT
p
amb
amb
exp
0
(7)
where
T
0
is the temperature of the soil at time
t
= 0 (when
Equation (6) starts to apply),
h
is the convection heat transfer
coefficient,
m
is the total mass of the soil, and
c
p
is the soil
specific heat capacity. This is estimated from the properties of
the soil constituents:
water
p
soil
p
p
mc
mc
mc
(8)
Equation (7) gives a theoretical decay curve which can be
fitted to the experimental data by changing
h
until the two
curves match. During steady state, conservation of energy
dictates that the heat flow rate across the soil is equal to the heat
flow rate at the top of the specimen from the soil to the air.
amb
top
top
base
T ThA
L
T T
A Q
(9)
This is used to calculate the thermal conductivity. It is worth
noting that this method introduces an error associated with the
estimation of the specific heat capacity from constituents whose
properties may not be accurately known.
Figure 2. Thermal cell.
3 METHODOLOGY
3.1
Measurement procedure
The thermal conductivity of U100 samples of London Clay
taken from a thermal response test borehole were tested using
both techniques described in Section 2. Before any
measurements were taken, the sealed samples were left in a
temperature controlled room overnight to equilibrate. Each
sample was treated as follows.
To accommodate the needle probe, a 200mm length
specimen was prepared and secured in a rubber membrane.
Shavings taken from the top of the sample were used to
determine the initial moisture content at the top. The soil was
found to be too hard to directly insert the probe. Therefore, a
5mm diameter hole had to be predrilled, and the hole filled with
a high thermal conductivity contact fluid (in this case toothpaste
was used) to reduce the contact resistance between the probe
and the soil (Hukseflux, 2003). The probe was inserted into the
hole, and secured with a clamp stand. It was then left for 20min
to equilibrate with the soil. A constant power was then supplied
to the needle probe heater for 300s, and then turned off. The
temperatures during the heating and recovery periods were
recorded. Using this procedure, five measurements were taken
over the cross-sectional area of the specimen. One measurement
was taken at the centre of the cross-section, the other four were
equally spaced at a radial distance of 25mm from the centre.
To reduce the time it takes to reach steady state, the
specimen was then cut in half and the top 100mm weighed and
secured to the platen of the thermal cell (see Figure 2), and
sealed at the top using aluminium foil to prevent moisture from
leaving the top of the sample. Shavings taken from the bottom
of the top half were used to determine the initial moisture
content at the bottom. Insulation was then wrapped around the
specimen. The temperature difference across the specimen is
measured by two thermistors, one secured to the top of the
platen, the other embedded at the top of the soil. The cartridge
heater was then turned on, and the power controlled so that the
platen remains at a constant temperature of 40°C. The power
was measured using a MuRata ACM20-5-AC1-R-C wattmeter.
Temperatures were monitored until steady state was reached
and then maintained for at least 2hours. The power to the
cartridge heater was then switched off, and the recovery period
monitored. At the end of the test, shavings were taken from the
top, middle and bottom of the specimen to determine the final
moisture contents.
The holes drilled into the specimen and the contact fluid
could potentially affect the thermal conductivity measurement
using the thermal cell. To verify the result, the bottom half of
the sample was also tested in the thermal cell, where these
effects would be less significant.
A full soil classification was then conducted based on the
British Standard 1377 (British Standards Institution, 1990), to
determine the soil density, moisture content, liquid limit, plastic
limit, particle density, and particle size distribution.


