 
          3368
        
        
          Proceedings of the 18
        
        
          th
        
        
          International Conference on Soil Mechanics and Geotechnical Engineering, Paris 2013
        
        
          After the bentonite heating described above, these samples
        
        
          werekeptat a constant temperature (22 3°C) and constant
        
        
          humidity (70% relative humidity) until the water contents of
        
        
          samples stopped changing.


          3 SWELLING PRESSURE AND SWELLING
        
        
          DEFORMATION OF BENTONITES
        
        
          AFTERSOMETHERMAL EXPOSURE
        
        
          This study used the experimental apparatus presented in Fig.
        
        
          2.The maximum capacity and the minimum scale of the load
        
        
          transducer were 10 kN and 0.0025 kN, respectively. The
        
        
          maximum capacity and the minimum resolution of the linear
        
        
          variable displacement transducer (LVDT)were, respectively, 25
        
        
          mm and 0.002 mm. This study conductedswelling characteristic
        
        
          experiments of twokinds. The swelling pressure test measured
        
        
          the bentonites’ swelling pressure as water was supplied to the
        
        
          confined bentonite specimen. The swelling deformation test
        
        
          measured the relationbetween the axial swelling deformation
        
        
          and the time from the start of water supply. Test
        
        
          proceduresweredescribed in an earlierarticle (Komine et al.,
        
        
          2009).
        
        
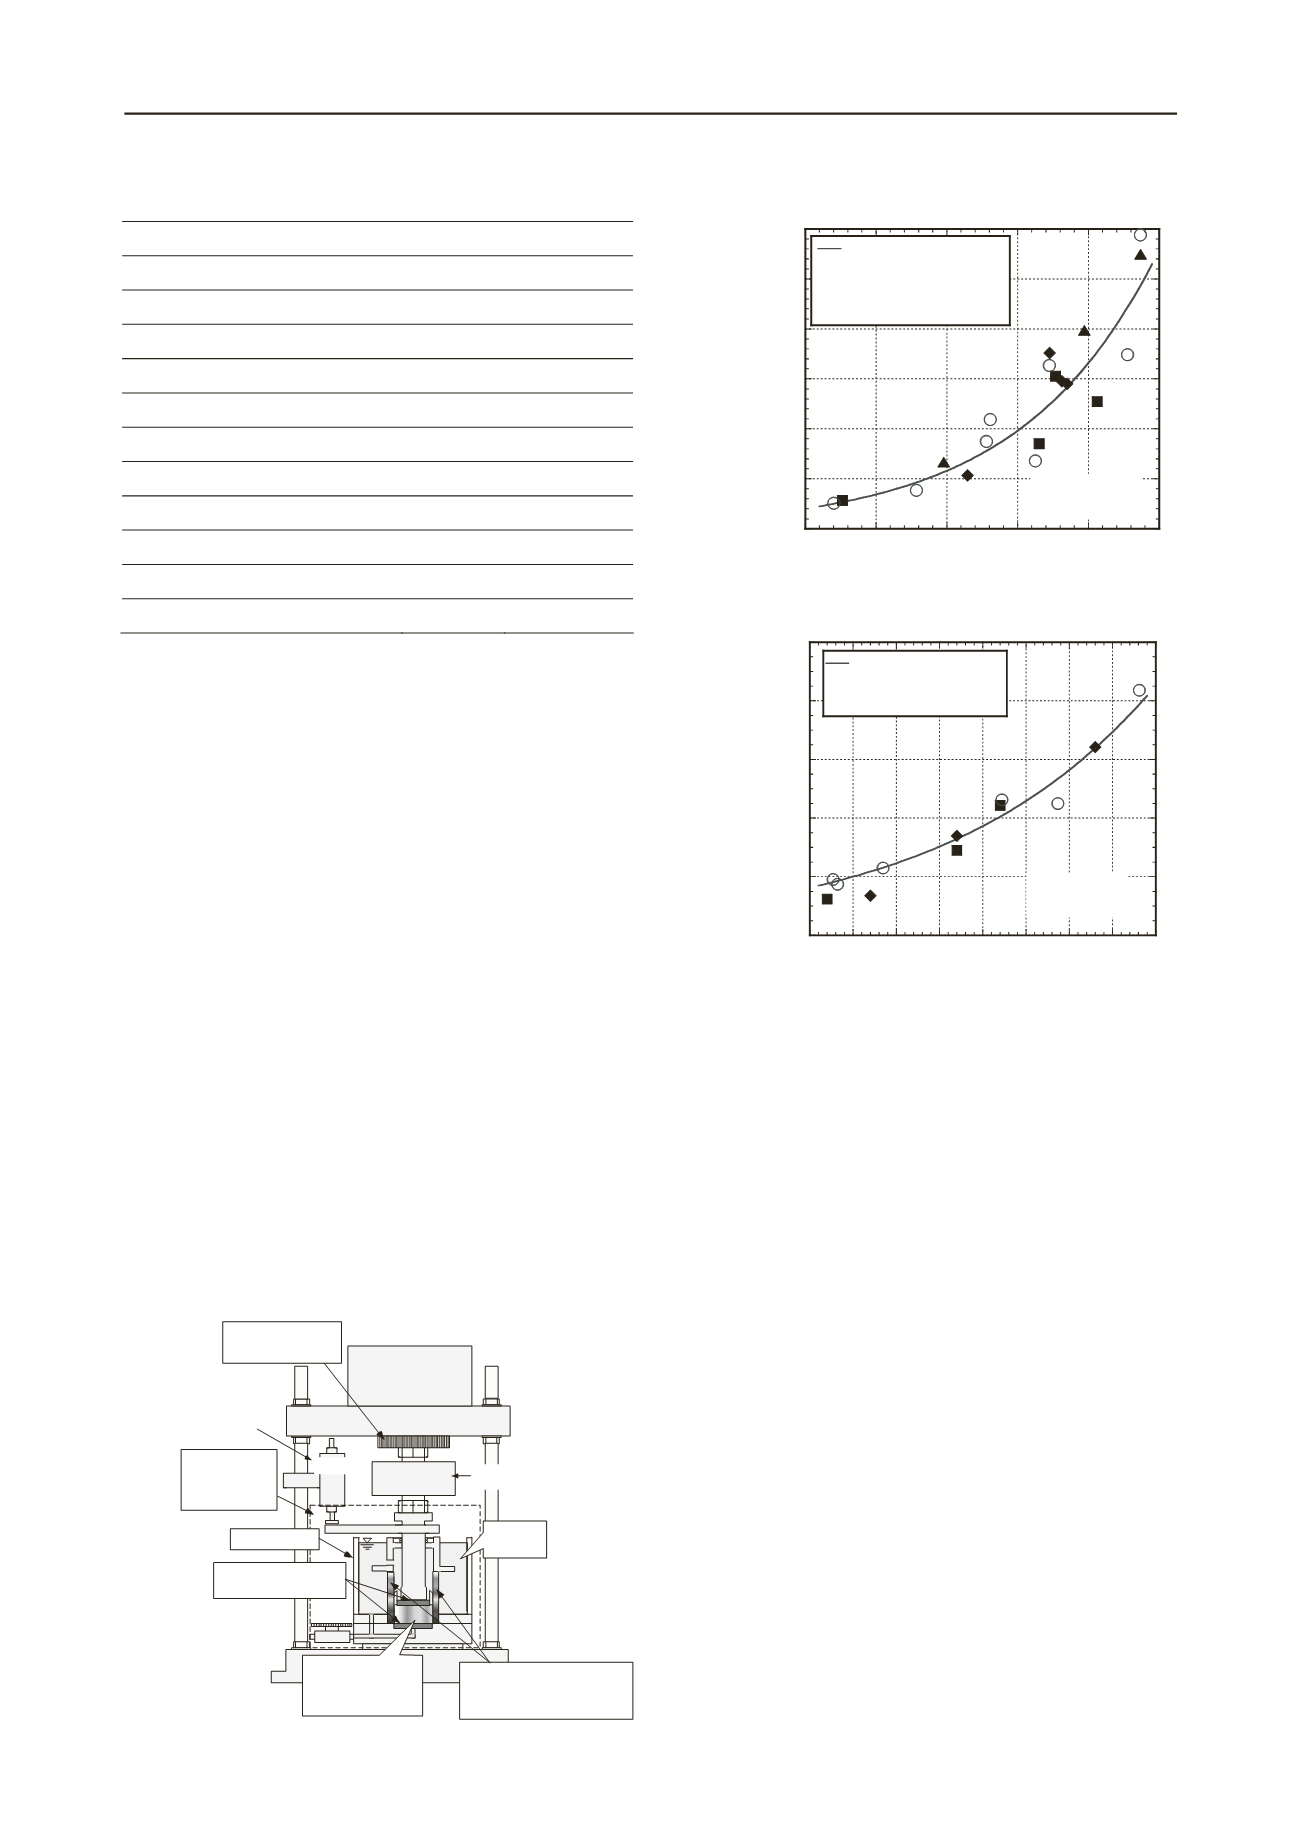
          Figure 3 portrays the relation between maximum swelling
        
        
          pressure and the initial dry density of bentonites’ thermal
        
        
          exposureduring swellingpressure tests. This figureshows that
        
        
          the influence of thermal exposureon swelling pressure
        
        
          characteristics of both bentonites is slight, provided that
        
        
          theheating temperature is less than 130°C and that the heating
        
        
          duration is less than 120 days.Regardingresultsobtained for
        
        
          calcium-type bentonite C depicted in Fig. 3(b), almost no
        
        
          influenceof
        
        
          thermal
        
        
          exposureon
        
        
          swelling
        
        
          pressure
        
        
          characteristics is shown for1.37–1.53 Mg/m
        
        
          3
        
        
          initial dry density.
        
        
          However, a slightinfluenceof thermalexposure is apparentat
        
        
          1.22–1.27 Mg/m
        
        
          3
        
        
          .
        
        
          0
        
        
          1000
        
        
          2000
        
        
          3000
        
        
          4000
        
        
          5000
        
        
          6000
        
        
          1.4 1.5 1.6 1.7 1.8 1.9
        
        
          Maximum swelling pressure, P
        
        
          smax
        
        
          (kPa)
        
        
          Initial dry density,


          d0
        
        
          (Mg/m
        
        
          3
        
        
          )
        
        
          ○
        
        
          : No heating
        
        
          ▲
        
        
          : 60 degree, 28 days
        
        
          ◆
        
        
          : 130 degree, 28 days
        
        
          ■
        
        
          : 130 degree, 120 days
        
        
          Bentonite A
        
        
          (Kunigel-V1)
        
        
          (a) Bentonite A
        
        
          0
        
        
          2000
        
        
          4000
        
        
          6000
        
        
          8000
        
        
          10000
        
        
          1.2 1.25 1.3 1.35 1.4 1.45 1.5 1.55 1.6
        
        
          Maximum swelling pressure, P
        
        
          smax
        
        
          (kPa)
        
        
          Initial dry density,


          d0
        
        
          (Mg/m
        
        
          3
        
        
          )
        
        
          ○
        
        
          : No heating
        
        
          ◆
        
        
          : 130 degree, 28 days
        
        
          ■
        
        
          : 130 degree, 120 days
        
        
          Bentonite C
        
        
          (Kunibond)
        
        
          (b) Bentonite C
        
        
          “No heating” in the legend denotes experimentally obtained results for
        
        
          bentonite with no thermal exposure. The temperature in the legend is
        
        
          the heating temperature by dryingoven. The days in the legend show
        
        
          the heating duration.
        
        
          Figure 3. Relationbetween maximum swelling pressure and initial dry
        
        
          density of bentonites A and B withthermal exposure.
        
        
          Table 1. Fundamental properties of bentonites A and C
        
        
          Bentonite
        
        
          A
        
        
          C
        
        
          Type
        
        
          Sodium
        
        
          Calcium
        
        
          Density of soil particle(Mg/m
        
        
          3
        
        
          )
        
        
          2.79
        
        
          2.71
        
        
          Liquid Limit (%)
        
        
          458.1
        
        
          128.7
        
        
          Plastic Limit (%)
        
        
          23.7
        
        
          38.4
        
        
          Plasticity index
        
        
          434.4
        
        
          90.3
        
        
          Montmorillonite content (%)
        
        
          57
        
        
          84
        
        
          Cation Exchange Capacity (meq/g)
        
        
          1.166
        
        
          0.795
        
        
          Exchange Capacity of Na
        
        
          +
        
        
          (meq/g)
        
        
          0.631
        
        
          0.119
        
        
          Exchange Capacity of Ca
        
        
          2+
        
        
          (meq/g)
        
        
          0.464
        
        
          0.585
        
        
          Exchange Capacity of K
        
        
          +
        
        
          (meq/g)
        
        
          0.030
        
        
          0.019
        
        
          Exchange Capacity of Mg
        
        
          2+
        
        
          (meq/g)
        
        
          0.041
        
        
          0.072
        
        
          Figure 4 shows the relation between maximum swelling
        
        
          strain and initial dry density of sodium-type bentonite A at
        
        
          vertical stresses of 1000 kPa and 500 kPa. Results in this
        
        
          figureshow that maximum swelling strain increases linearly as
        
        
          theinitial dry density increases. For the sodium-type bentonite A,
        
        
          the swelling deformation property of bentonite after thermal
        
        
          exposure is almost unchangedunder 1000 kPa vertical stress.
        
        
          However, the swelling deformation property of bentonite
        
        
          isgreatlyreduced for heating at 90–130°C fora 365-day heating
        
        
          duration under conditions of 500 kPa vertical stress, as
        
        
          portrayed in Fig. 4(b). Those results indicate that the thermal
        
        
          influence to swelling deformation characteristics of sodium-type
        
        
          bentonite A is dependent onthe vertical stress condition. The
        
        
          influences of thermal exposureon swellingdeformation decrease
        
        
          for high vertical stresssuch as 1000 kPa. Thisdiscussion shows
        
        
          agreement with previously presenteddiscussionindicating that
        
        
          swelling pressure characteristics of bentonite Ashowalmost no
        
        
          change according to thermal exposure, as depicted in Fig. 3(a)
        
        
          and previously reportedexperimentally obtained results
        
        
          (Komine and Ogata, 1998) showing thatswelling deformation
        
        
          Load
        
        
          transducer
        
        
          Distilled
        
        
          water
        
        
          Compressed air
        
        
          cylinder for
        
        
          loading
        
        
          Clamp for fixing
        
        
          the piston
        
        
          LVDT
        
        
          Porous metal and
        
        
          nonwoven filter
        
        
          Acrylic cell
        
        
          Swelling cell
        
        
          (Inside of
        
        
          broken lines)
        
        
          Specimen
        
        
          Diameter 28 mm
        
        
          Height 10 mm
        
        
          316L stainless steel ring
        
        
          Inner diameter 28 mm
        
        
          Height 50 mm
        
        
          Maximum capacity = 10 kN
        
        
          Minimum scale = 0.0025 kN
        
        
          Maximum capacity = 25 mm
        
        
          Minimum scale = 0.002 mm
        
        
          Figure 2. Experimental apparatus.