3372
Proceedings of the 18
th
International Conference on Soil Mechanics and Geotechnical Engineering, Paris 2013
Figure 1. Typical pile heat exchanger at the site (after breaking down to
pile cut off level).
2.1 Ground Conditions
The site is underlain by a sequence of London Basin deposits.
The piles are founded in the London Clay at 21m depth, but also
pass through a significant thickness of superficial and man-
made deposits (Table 1). As the site is located close to the
confluence of the Thames and the River Lea in east London, the
groundwater table is close to the ground surface, near to the
base of the Made Ground.
Table 1. Table Ground Conditions.
Strata
Description
Depth (m)
Made Ground
Fine to coarse brick and
concrete gravel; soft to firm black
sandy gravelly clay.
3.3
Alluvium
Very soft clayey silt, sandy
clay and peat.
6.3
River Terrace
Deposits
Medium dense silty fine to
coarse sand and fine to coarse
gravel (mainly flint)
11.2
London Clay
Stiff thinly laminated fissured
silty clay with silt partings
23.5
2.2 Instrumentation
One 1200mm diameter pile near the north east corner of the
building was selected for monitoring. The pile was equipped
with five thermistor strings. One of these was attached to the
central bundle of plastic pipes, themselves inserted into the pile
attached to a 40mm steel bar for stiffness (Figure 2). The U-
pipes, the steel bar and the thermistor strings were installed to a
depth of 20m within the pile. The other four thermistor strings
were attached at equal spacings around the circumference of the
steel reinforcing cage (Table 2). As the pile cage only extends
to 8.5m below the pile cut off level it was not possible to extend
the outer thermistor strings over the full 21m pile depth.
3 BACKGROUND DATA
Following construction of the pile, selected thermistors were
monitored for approximately one month to provide an indication
of the heat of hydration. During this period the groundworks
beneath the building footprint were completed and all the pipe
circuits were constructed as far as the header chambers. At this
point it became possible to data log all the monitoring points to
obtain information on the background soil temperatures at
different depths.
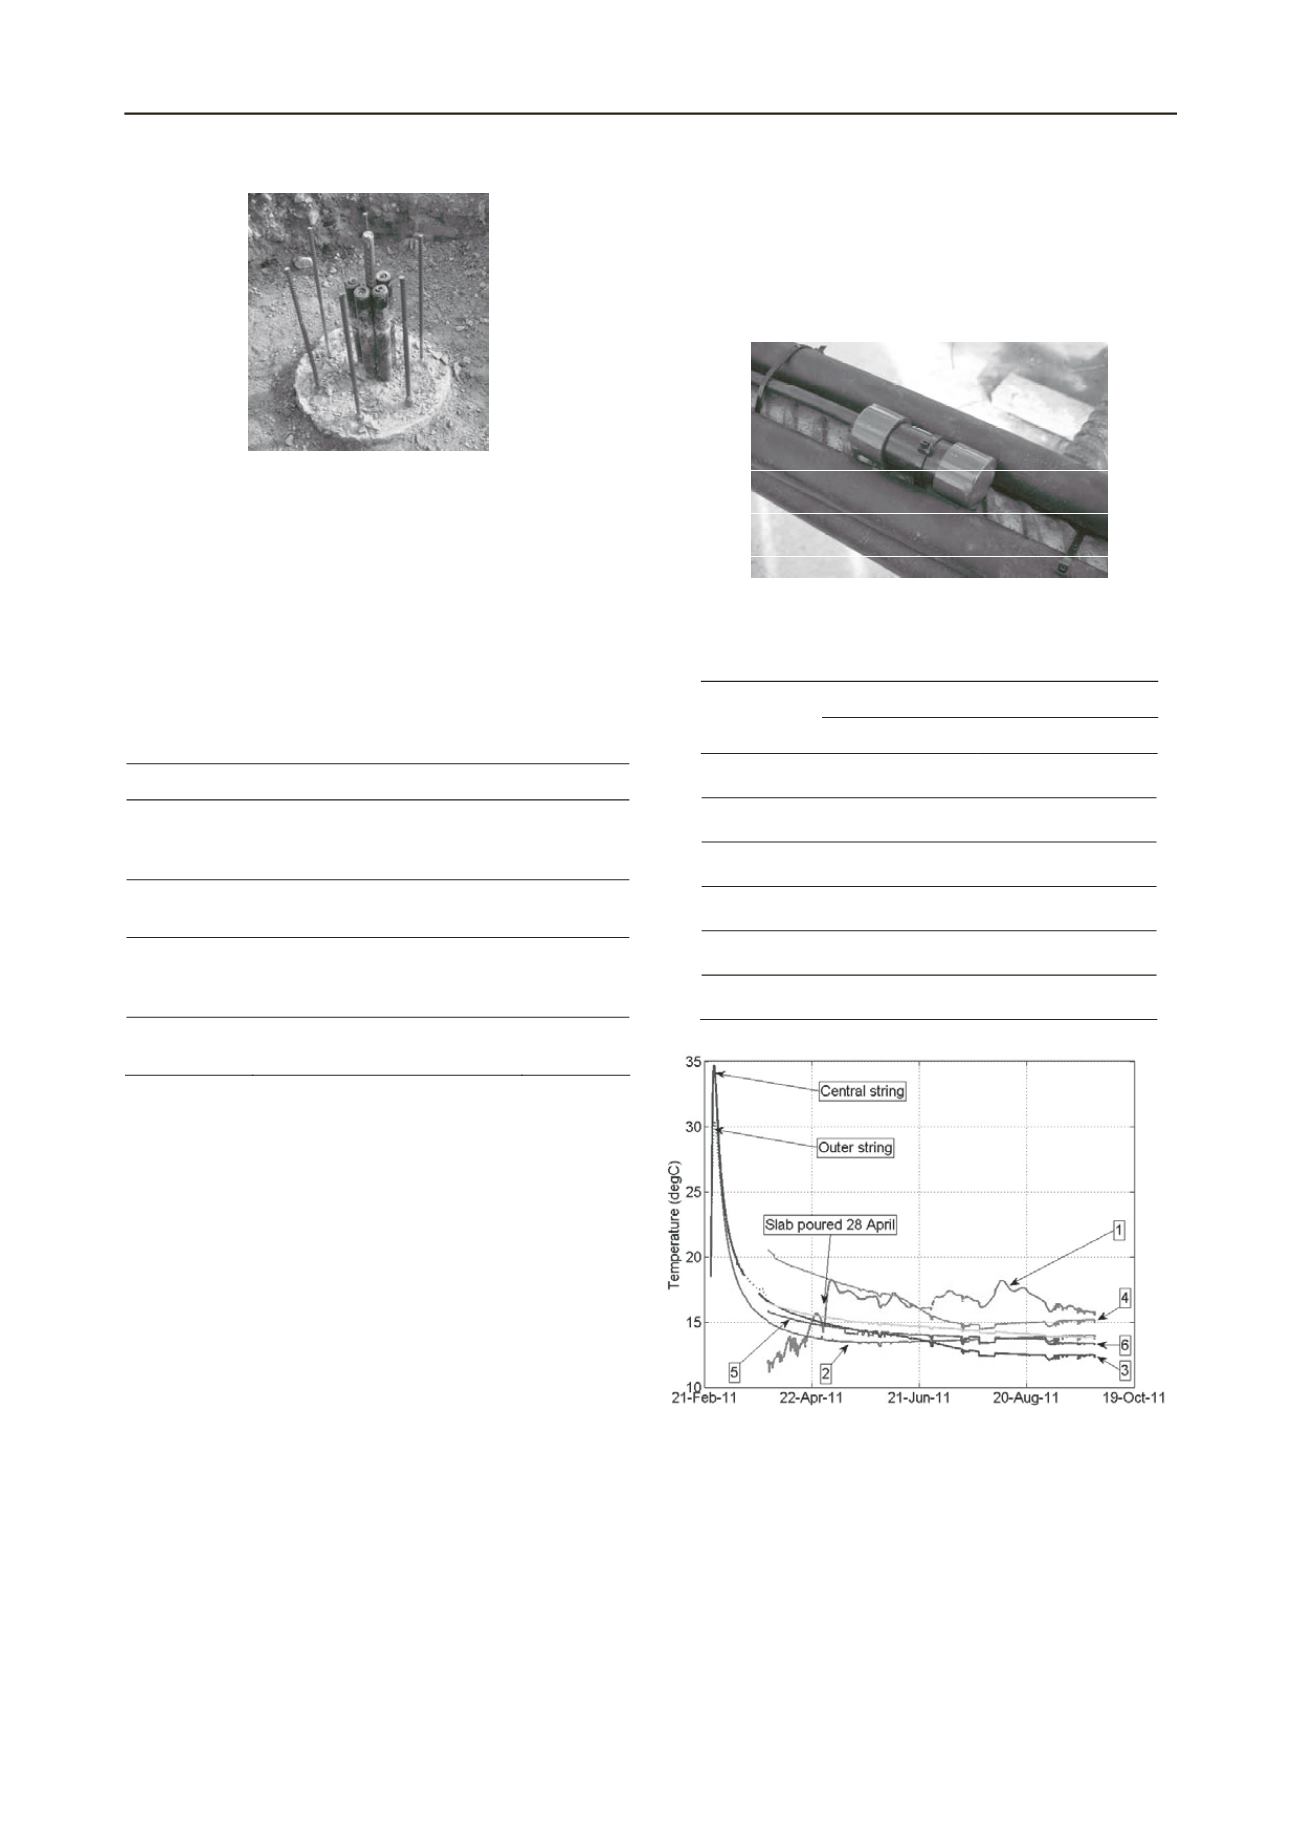
These initial data are presented in Figure 3. It can be seen
that during curing the pile reaches temperatures of almost 35
o
C
at its centre, but that this reduces to approximately 30
o
C closer
to the pile edge. In the main part of the pile, it takes over two
months for the heat of hydration to dissipate fully and
temperatures to return to between 13
o
C and 15
o
C. The near
surface monitoring points (thermistor level 1, Figure 3) are
influenced by the ambient air conditions. Within one month
(when monitoring of these points first commenced) the
thermistors at level 1 are already showing daily and longer term
seasonal fluctuations reflecting the local air temperature.
Figure 2. Base of the central thermistor string prior to installation of the
U-tubes and steel bar.
Table 2. Depths of thermistors installed with the pile.
Depth Below Pile Cut Off Level (m)
Thermistor
Level
Central String
Outer Strings
1
0.7
0.75
2
3.6
3.25
3
7.1
6.6
4
11.1
-
5
15.1
-
6
19.1
-
Figure 3. Initial pile temperatures during and after concrete curing
(numbers refer to thermistor string levels).
The level 1 thermistors also show a distinct increase in
temperature at the end of April 2011, coincident with the date at
which the floor slab for the building was cast. This temperature
increase will represent the additional heat of hydration from the
concrete slab. Following this time, daily variations of
temperature are also reduced due to the additional insulation. It
is also interesting to note these level 1 temperatures appear to
remain elevated for some time after the slab is cast; although it
is difficult to separate this effect from that of the surface air
temperature which would also be increasing at this time of year.


