3377
Technical Committee 307 + 212 /
Comité technique 307 + 212
3.2
Data analysis
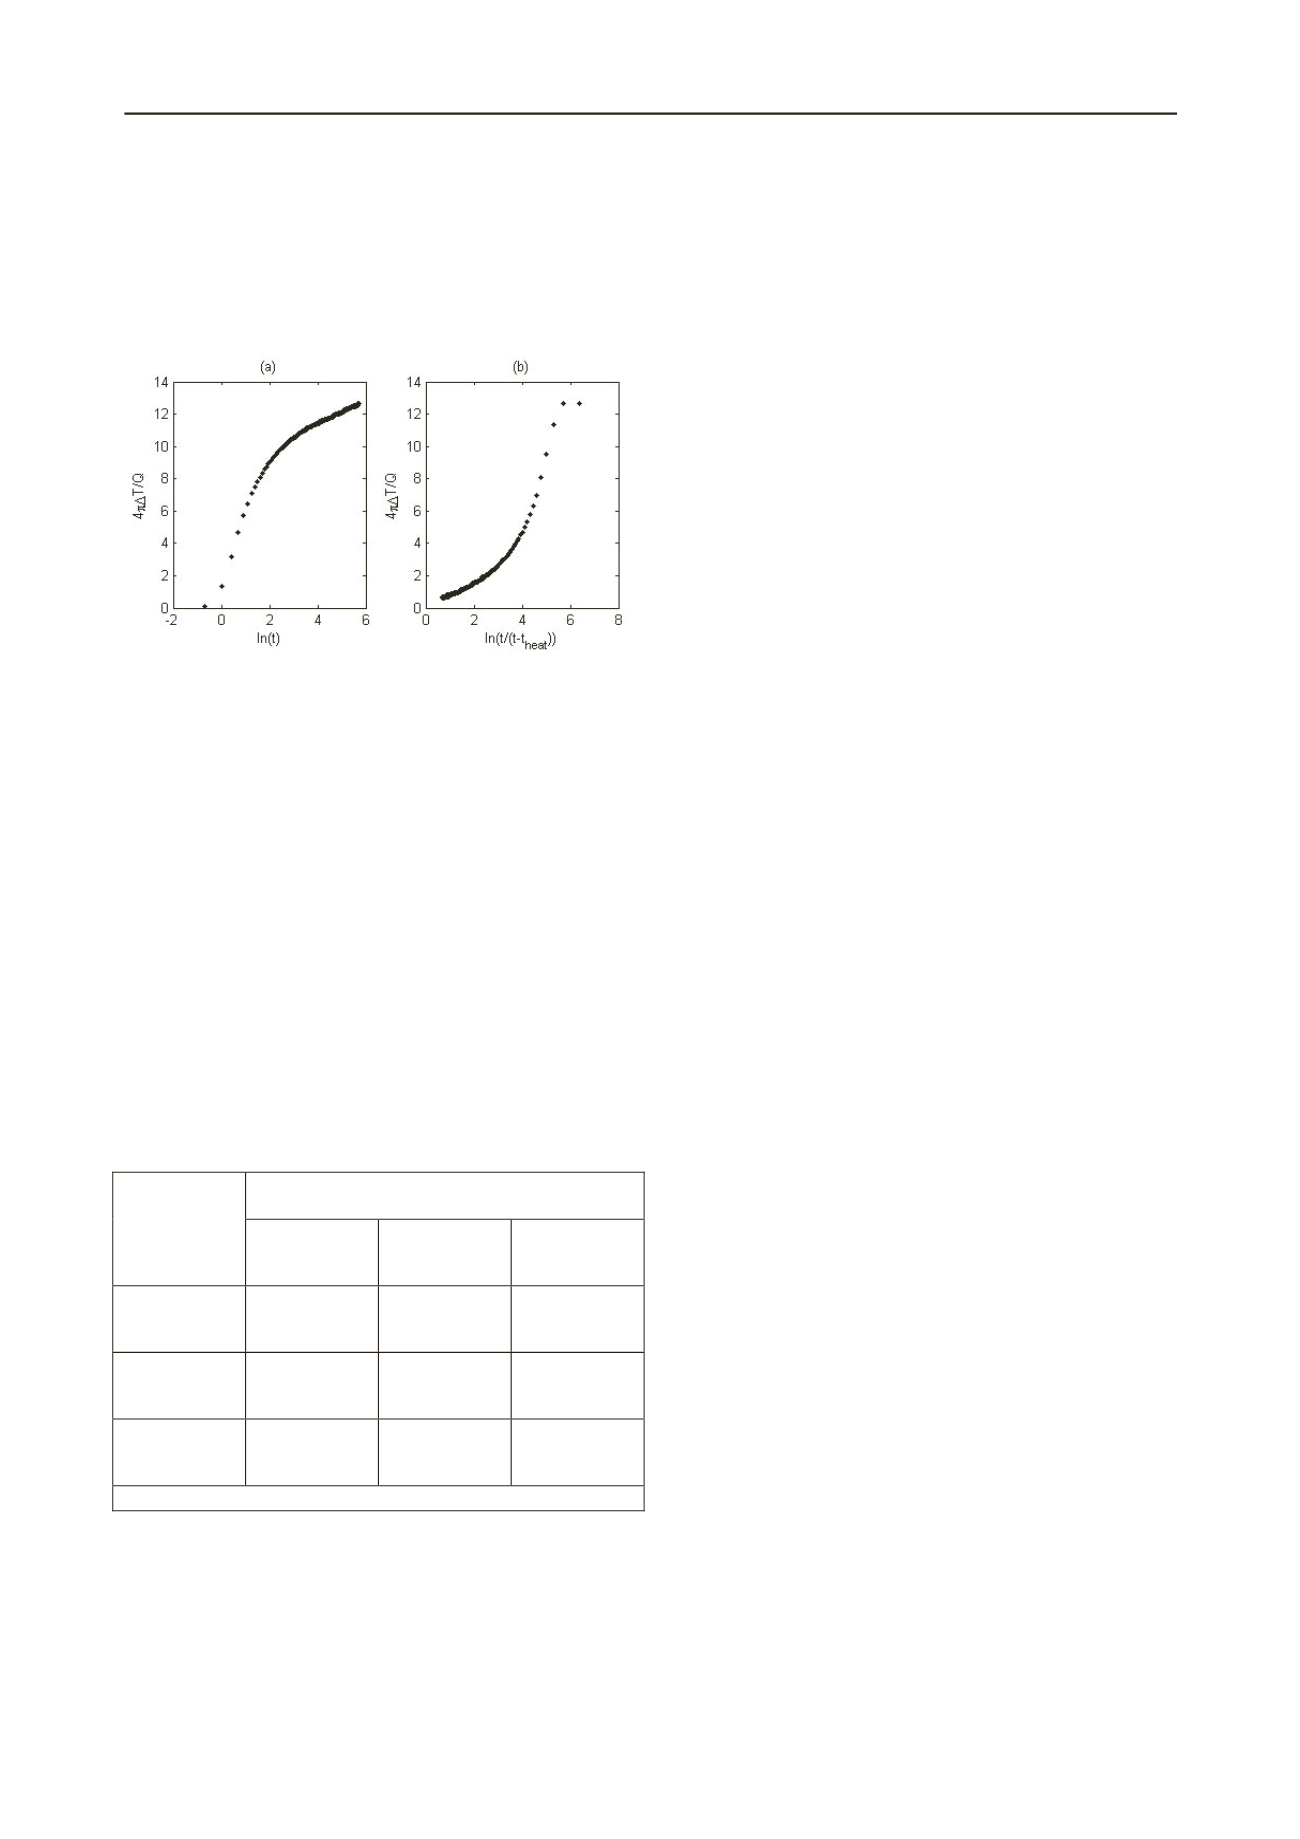
For the needle probe, using Equations (3) and (4) for heating
and recovery respectively, graphs were plotted of temperature
against the natural logarithm of time, and the gradient of the
straight line section used to determine the thermal conductivity.
A typical result is shown in Figure 3.
Figure 3. Graph of needle probe data for (a) heating and (b) recovery.
For the thermal cell, average temperatures during the steady
state period were calculated for each thermistor. The average
power supplied to the cartridge heater was also calculated.
Equation (5) was then used to determine the thermal
conductivity.
4 RESULTS AND DISCUSSION
The results of the tests are shown in Table 1, with the average
value of the five needle probe readings given. The needle probe
consistently gave lower values of thermal conductivity than the
thermal cell. The sample properties are given in Table 2, where
the moisture content given is the average of the values before
and after testing. There is a decrease in thermal conductivity
with depth. This may be due to a decrease in density, and also
change in mineralogy. The top two samples were of firm
slightly sandy clay. The bottom sample had a significant
number of fissures, and a slightly greater sand content.
Table 1. Thermal conductivity measured using the needle probe for
heating and recovery, and using the thermal cell.
Thermal conductivity (Wm
-1
K
-1
)
Sample depth
(m)
Needle probe
in heating
Needle probe
in recovery
Thermal cell
8.00-8.45
1.47
1.30
2.01 (t)*
1.88 (b)
10.00-10.45
1.24
1.36
1.85 (t)
1.91 (b)
19.00-19.45
1.06
0.93
1.65 (t)
1.75 (b)
*t – top half; b – bottom half.
4.1
Needle probe
The variation in the five needle probe readings within the same
sample was about ±10% for heating and ±15% for recovery.
The sample at depth 19.00-19.45m had less variation. When the
needle probe was previously tested using five identical agar gel
samples, it gave a repeatability of ±2% for both heating and
recovery, so most of the variation in results would seem to be
due to natural variation in thermal conductivity of the soil.
The greatest disadvantage with the needle probe is in the
interpretation of results relying on human judgement. The
calculated thermal conductivity is highly sensitive to the
selection of the part of the graph deemed to be a straight line.
Another factor which may affect the results is the use of contact
fluid. In theory, the contact fluid should only decrease the time
it takes to reach the straight line section of the graph, i.e. it
should have no effect on the calculated thermal conductivity.
However, the fluid could potentially seep into cracks in the soil,
and in doing so alter the thermal conductivity. After testing, the
specimens were cut up to see if this was the case. The soil at
depths of 8.00-8.45m and 10.00-10.45m did not contain many
fissures, and the contact fluid seemed to have stayed within the
drilled holes. It can therefore be assumed that the contact fluid
had little effect on the needle probe results. However, for the
sample at depth 19.00-19.45m there were a significant number
of fissures, which contact fluid had seeped into. This could
affect both needle probe and thermal cell measurements, giving
higher thermal conductivity results than otherwise.
4.2
Thermal cell
In Section 2.2, two methods for calculating the thermal
conductivity using the thermal cell were outlined. One involves
measuring the power directly, the other uses the lumped
capacitance method to calculate the power. Only the first
method was deemed suitable for this study, as the temperature
difference across the soil after the power is switched off was too
great for lumped capacitance to apply i.e. Equation (6) was not
satisfied.
The difference in thermal conductivity values between the
top and bottom sections was about 0.1Wm
-1
K
-1
. If the holes for
the needle probe were to have a significant effect on the thermal
conductivity values, the measurement for the top section would
be expected to always be higher than for the bottom section, or
vice versa. This is not the case, and as the area of the holes is
only 1.25% of the total cross-sectional area, it can be assumed
that the differences between the top and bottom sections are
mainly due to the soil’s natural variability.
The moisture content at the top of the specimens were
measured before and after the thermal cell tests. The values
after the test were consistently higher than those before the test.
The greatest increase in moisture content was 5.2%. This shows
that over the long heating period, moisture migration occurs in
the direction of heat flow. This is where a temperature gradient
causes the water to transfer latent heat through the pores as
described by the liquid-island theory (Philip and de Vries,
1957). This theory suggests that in fairly dry media, the water is
deposited in isolated pockets or 'islands', either filling small
pores or attaching themselves between soil grains. When a
temperature gradient is applied, there is a vapour flux in the
direction of heat flow. Water evaporates from one island, and
condenses at the boundary of the next island, thereby
transferring heat from one island to the next.
4.3
Comparing test methods
The measured thermal conductivity for the thermal cell is higher
than that of the needle probe by 40%, 45%, and 71% for a depth
of 8.00-8.45m, 10.00-10.45m, and 19.00-19.45m respectively.
This could be explained by a number of factors. The needle
probe and thermal cell measure the thermal conductivity in the
radial and axial directions respectively. It could be that the soil
is anisotropic, and naturally has a higher thermal conductivity in
the axial direction. However, the layers in the soil sample
tended to be in the horizontal direction i.e. perpendicular to the
cylinder axis. The thermal conductivity measured parallel to the
layering should in general be higher than that measured
perpendicular to the layering (Midttømme and Roaldset, 1998).
If anisotropy was the reason behind the difference between
needle probe and thermal cell values, then the needle probe
would be expected to give higher values of thermal conductivity


