 
          3349
        
        
          Technical Committee 307 + 212 /


            Comité technique 307 + 212


          The adopted model parameters are shown in Table 2. In all
        
        
          the analyses undertaken,


          for the concrete was held constant
        
        
          with a value of 3.0E-5°K
        
        
          -1
        
        
          (note that the coefficient of linear
        
        
          thermal expansion,


          =


          /3). The values of


          assumed for the
        
        
          so
        
        
          order to
        
        
          d thermal
        
        
          e thermal
        
        
          Table 2.
        
        
          med for num
        
        
          ysis.


            Concrete


            Soil


          il were zero, half and double that for the concrete;
        
        
          representing a moderately OC clay.
        
        
          In addition, the Young’s modulus of the soil was increased
        
        
          by a factor of two from the base value of 30 MPa, in
        
        
          assess the effect of this parameter on the predicte
        
        
          response of the pile.
        
        
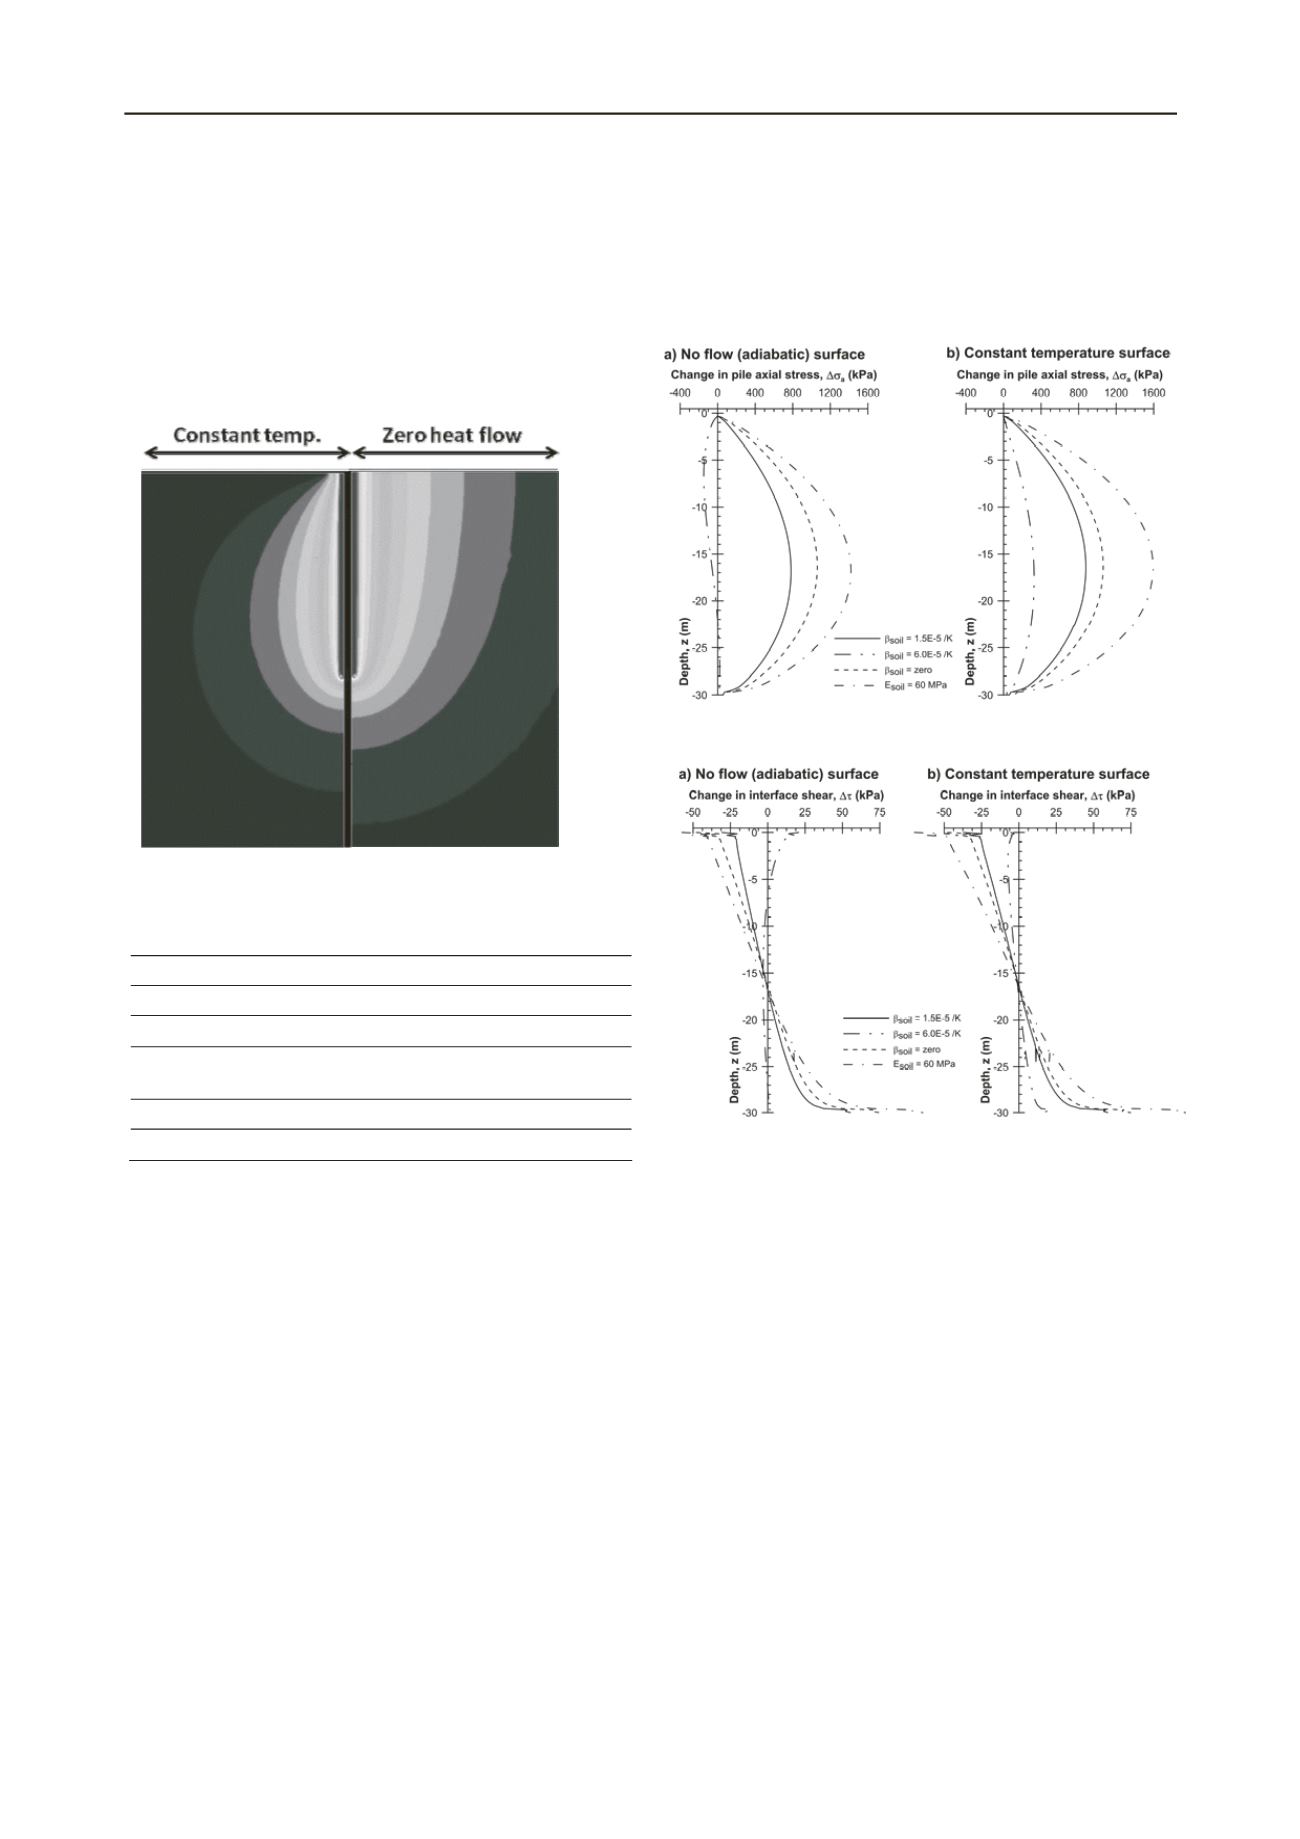
          Figure 3. Steady-state temperature field as function of surfac
        
        
          oundary condition (contour interval: 2°C)
        
        
          b
        
        
          Material parameters assu
        
        
          erical anal


            Parameter


          Young’s modulus, E (MPa)
        
        
          30000
        
        
          30 or 60
        
        
          Poisson’s ratio,


          ( - )
        
        
          0.3
        
        
          0.3
        
        
          Coefficient of volumetric thermal
        
        
          -1
        
        
          expansion,


          (E-5, °
        
        
          K
        
        
          )
        
        
          3.0
        
        
          0,
        
        
          r
        
        
          1.5 o
        
        
          6.0
        
        
          Thermal conductivity, k (kJ/hr.m.K)
        
        
          8.4
        
        
          4.0
        
        
          Volumetric heat capacity,


          c
        
        
          p
        
        
          (kJ/m
        
        
          3
        
        
          .K)
        
        
          1950
        
        
          1500
        
        
          3 PREDICTIONS
        
        
          3.1


            Coefficient of thermal expansion


          The effect of changes in the value of the coefficient of
        
        
          volumetric thermal expansion,


          of the soil, the stiffness of the
        
        
          soil and the thermal boundary condition on the ground surface
        
        
          of the model are illustrated, in terms of changes in pile axial
        
        
          stress, Fig. 4 and pile-soil interface shear, Fig. 5.
        
        
          When comparing the plots, the dashed line for the


          = zero
        
        
          case (the soil is thermally inert) provides a baseline for
        
        
          comparison, as the results are independent of the thermal
        
        
          boundary condition on the ground surface.
        
        
          When the soil is less thermally expansive than the pile, i.e.


          = 1.5E-5°K
        
        
          -1
        
        
          and zero, heating the pile led to compressive axial
        
        
          stress with the maximum stress change for each


          -value
        
        
          equating to about +12% and +15% of the stress that would be
        
        
          mobilised if the pile was fully restrained, P
        
        
          fix
        
        
          (Table 3). The
        
        
          constant temperature boundary condition results in slightly
        
        
          greater (1 to 2%) restraint of the pile thermal expansion and
        
        
          thus, higher compressive axial stress are developed.
        
        
          The effect of the thermal boundary condition on the ground
        
        
          surface becomes clearer when the soil is assumed to be more
        
        
          expansive than the pile (


          = 6.0E-5°K
        
        
          -1
        
        
          ); when a zero heat flow
        
        
          condition was assumed, the pile went into tension (max. stress
        
        
          about -2% of P
        
        
          fix
        
        
          ) however, as identified above, the use of a
        
        
          constant temperature boundary condition resulted in greater
        
        
          restraint and the resulting stress changes were compressive
        
        
          (m . stress about +5% of P
        
        
          fix
        
        
          ) along the entire length of the
        
        
          and therefore the variation in
        
        
          r with depth).
        
        
          e coefficient of volumetric thermal
        
        
          e of the model being elastic and the
        
        
          int
        
        
          iles inferred from observations in test
        
        
          pil
        
        
          ax
        
        
          pile.
        
        
          Figure 4. Change in pile axial stress due to temperature change of
        
        
          +30°C, Cruz Silva 2012.
        
        
          Figure 5. Change in pile-soil interface shear stress due to temperature
        
        
          change of +30°C, Cruz Silva 2012.
        
        
          The shape of the profiles of predicted axial stress change
        
        
          (approx. parabolic) in Fig. 4 are directly related to the shape of
        
        
          the profile of mobilised friction at the pile-soil interface, Fig. 5
        
        
          which is approximately linear (note that in Fig. 1 the mobilised
        
        
          friction was assumed constant
        
        
          axial stress was linea
        
        
          Here again the effect of th
        
        
          expansion of the soil and the thermal boundary condition on the
        
        
          ground surface is seen. As the contrast in


          -values of the pile
        
        
          and the soil increases, the magnitude of the predicted change in
        
        
          shear stress on the pile-soil interface, and the constant
        
        
          temperature condition leads to larger changes in shear stress
        
        
          compared to the zero heat flow condition.
        
        
          As a consequenc
        
        
          erface not being modelled explicitly, i.e. with an appropriate
        
        
          stiffness and limiting strength, the shape of the interface friction
        
        
          (shear stress) profiles differs from that expected based on the
        
        
          simple model in Fig. 1 (which effectively assumes perfect
        
        
          plasticity) and the prof
        
        
          es, Amatya et al. 2012. The variation in shear stress along the
        
        
          pile-soil interface suggested here is only likely to be correct
        
        
          while the maximum stress values are below the yield strength
        
        
          on the interface.