3356
Proceedings of the 18
th
International Conference on Soil Mechanics and Geotechnical Engineering, Paris 2013
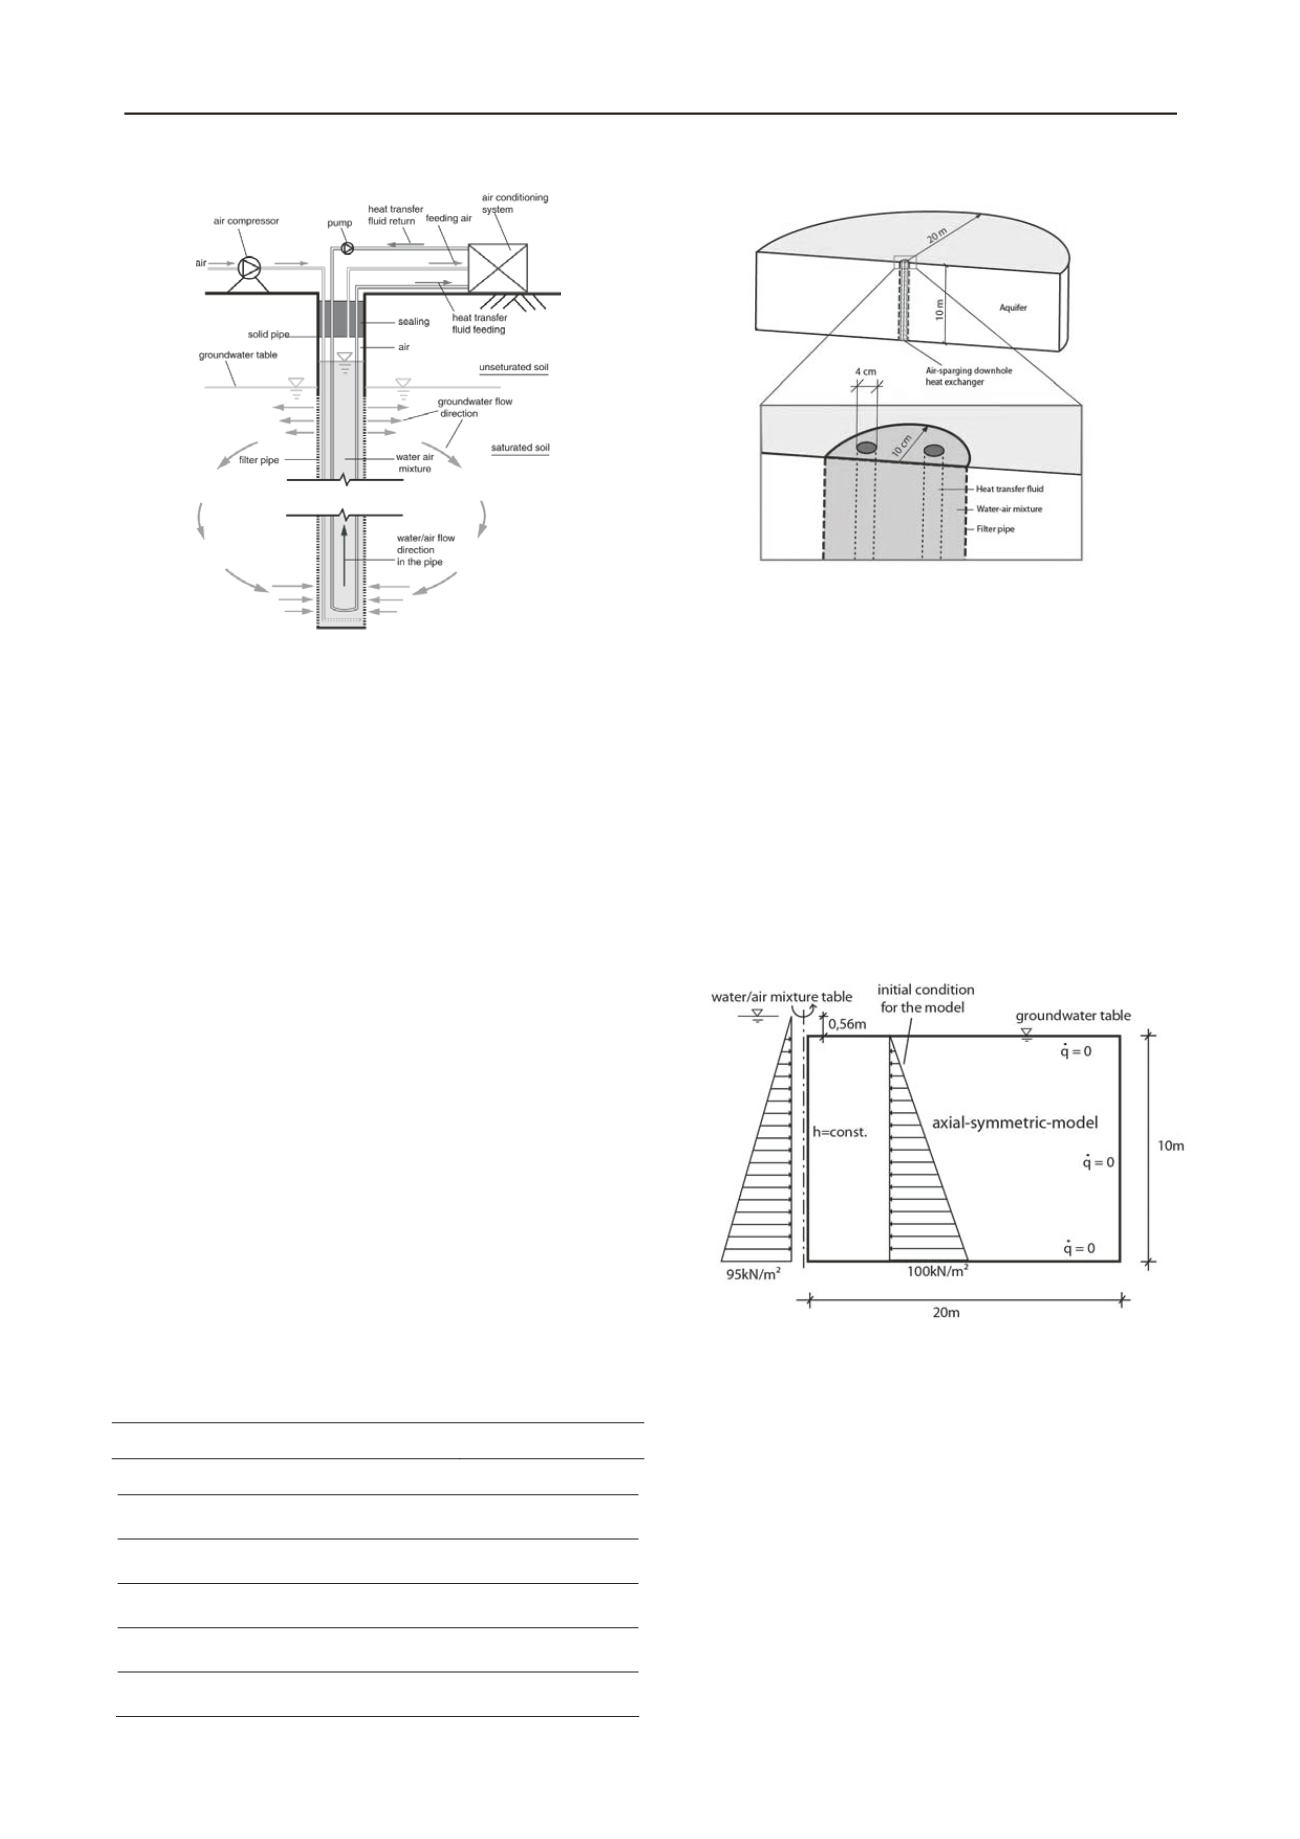
Figure 1. Combination of an air-sparging downhole heat exchanger with
an air conditioning system
The combination of a borehole heat exchanger with an air-
injection well increases the performance of the system shown in
Figure 1 in three ways. First, the groundwater cools the air
before it reaches the air conditioning system, therefore reducing
the energy necessary for the A/C. Second, the vertical flow of
the air-water mixture inside the well increases the heat
exchange between the heat pipes and the groundwater
(Gustafsson, Westerlund and Hellström 2010). And third, the
circulation of the groundwater increases the heat convection in
the subsurface which leads to a higher efficiency of the overall
system.
2.2 Numerical model
The simulations of the air-injection borehole heat exchanger
were done with the finite-element program COMSOL
multiphysics. A three-dimensional model was used. The
geothermal system has a radius of 10 cm and the thickness of
the aquifer is 10 m. Prior to the air injection there is no
groundwater flow. Four pipes are introduced into the well. The
induced groundwater flow, as well as the convective heat
transfer are modeled using the FEM. Flow inside the well itself
and inside the heat pipes is neglected. The pipes are simplified
represented as cylindrical heat sources with constant
temperatures.
The aquifer is assumed to consist of homogeneous sand.
Several variations concerning heat conductivity, permeability of
the soil and density of the air-water-mixture are simulated with
the model shown in Figure 2. The used thermal and hydraulic
parameters are listed in Table 1. The bold values can be
considered to be standard parameters.
Table 1. Applied thermal and hydraulic parameters of the soil and the
air-water-mixture
Thermal conductivity sat. soil (W/(m · K))
1.5/2.0/
2.5
/3.0/3.5
Specific heat capacity sand (J/(kg · K))
800
Effective porosity (-)
0,25
Density of water (kg/m³)
1000
Density of air-water-mixure (kg/m³)
900/950/980/
990
Density of sand grains (kg/m³)
2650
Permeability (m/s)
10
-7
~
10
-4
~ 10
-3
Figure 2. Numerical model for the simulation of an air-sparging
ownhole heat exchanger
d
The induced groundwater flow increases heat transport through
convection. All calculations assume that the hydraulic and
thermal parameters of the soil are temperature independent.
This means that groundwater flow is not influenced by heat
transport. Both mechanisms – groundwater flow and heat
transport – are considered separately. The first step is to
simulate the groundwater flow until stationary conditions are
reached. The results are saved and in the second step the results
are superimposed by the heat propagation in the soil in 90 days.
Before the air injection the well experiences a hydrostatic
pressure distribution. As a boundary condition for the
simulation the wall of the well experiences a constant pressure
distribution from the air-water-mixture, which has a smaller
density but a higher water level than the surrounding
groundwater. Boundary conditions are shown in Figure 3 (Ma
and Grabe 2011).
Figure 3. Boundary and initial conditions of the model for calculation of
the groundwater circulation caused by air-sparging with an air-water-
mixture with a density of 990 kg/m³
3 NUMERICAL RESULTS
3.1
Groundwater flow
The groundwater flow induced by the air injection is calculated
until stationary conditions are reached. The arrows in Figure 4
show the calculated velocity vectors of the groundwater. The
highest velocity (approx. 1.2 · 10
-5
m/s) can be found close to
the well. With increasing distance to the well the velocity
decreases. The flow lines show the groundwater circulation. The
bold parameters from table 1 achieve a water exchange rate
between well and soil of about 0.06 m³/h.


