3036
Proceedings of the 18
th
International Conference on Soil Mechanics and Geotechnical Engineering, Paris 2013
4.2 Longitudinal and transverse dispersivities
Figures 5 and 6 illustrate the estimates of longitudinal and
transverse dispersivities in comparison with the mean value of
laboratory experiments and reported values (Forrer et al., 1999;
Abbasi et al., 1995). Longitudinal and transverse dispersivity
estimates ranged from 1.00 cm to 3.72 cm and from 0.52 cm to
2.35 cm respectively, which are good agreement with reported
values, indicating the effectiveness of the developed
methodology. Also, the ratio of longitudinal to transverse
dispersivities was in the range of 1 to 5.4, which is in the lower
range of dispersivity ratios reported in porous media (Persson
and Berndtsson, 2002).
As a whole, both dispersivity values are slight larger than
those identified in the laboratory. This is attributed to the
difference between undisturbed soil in the field and disturbed
soil in the laboratory. In addition, dye tracer moved through the
soils in a preferential flow pattern, which induced higher
dispersivities in more irregular flow patterns as compared with
estimates obtained in laboratory tracer experiments. At the
experimental site, some macropores were confirmed and
influenced seepage and solute pathways in porous media.
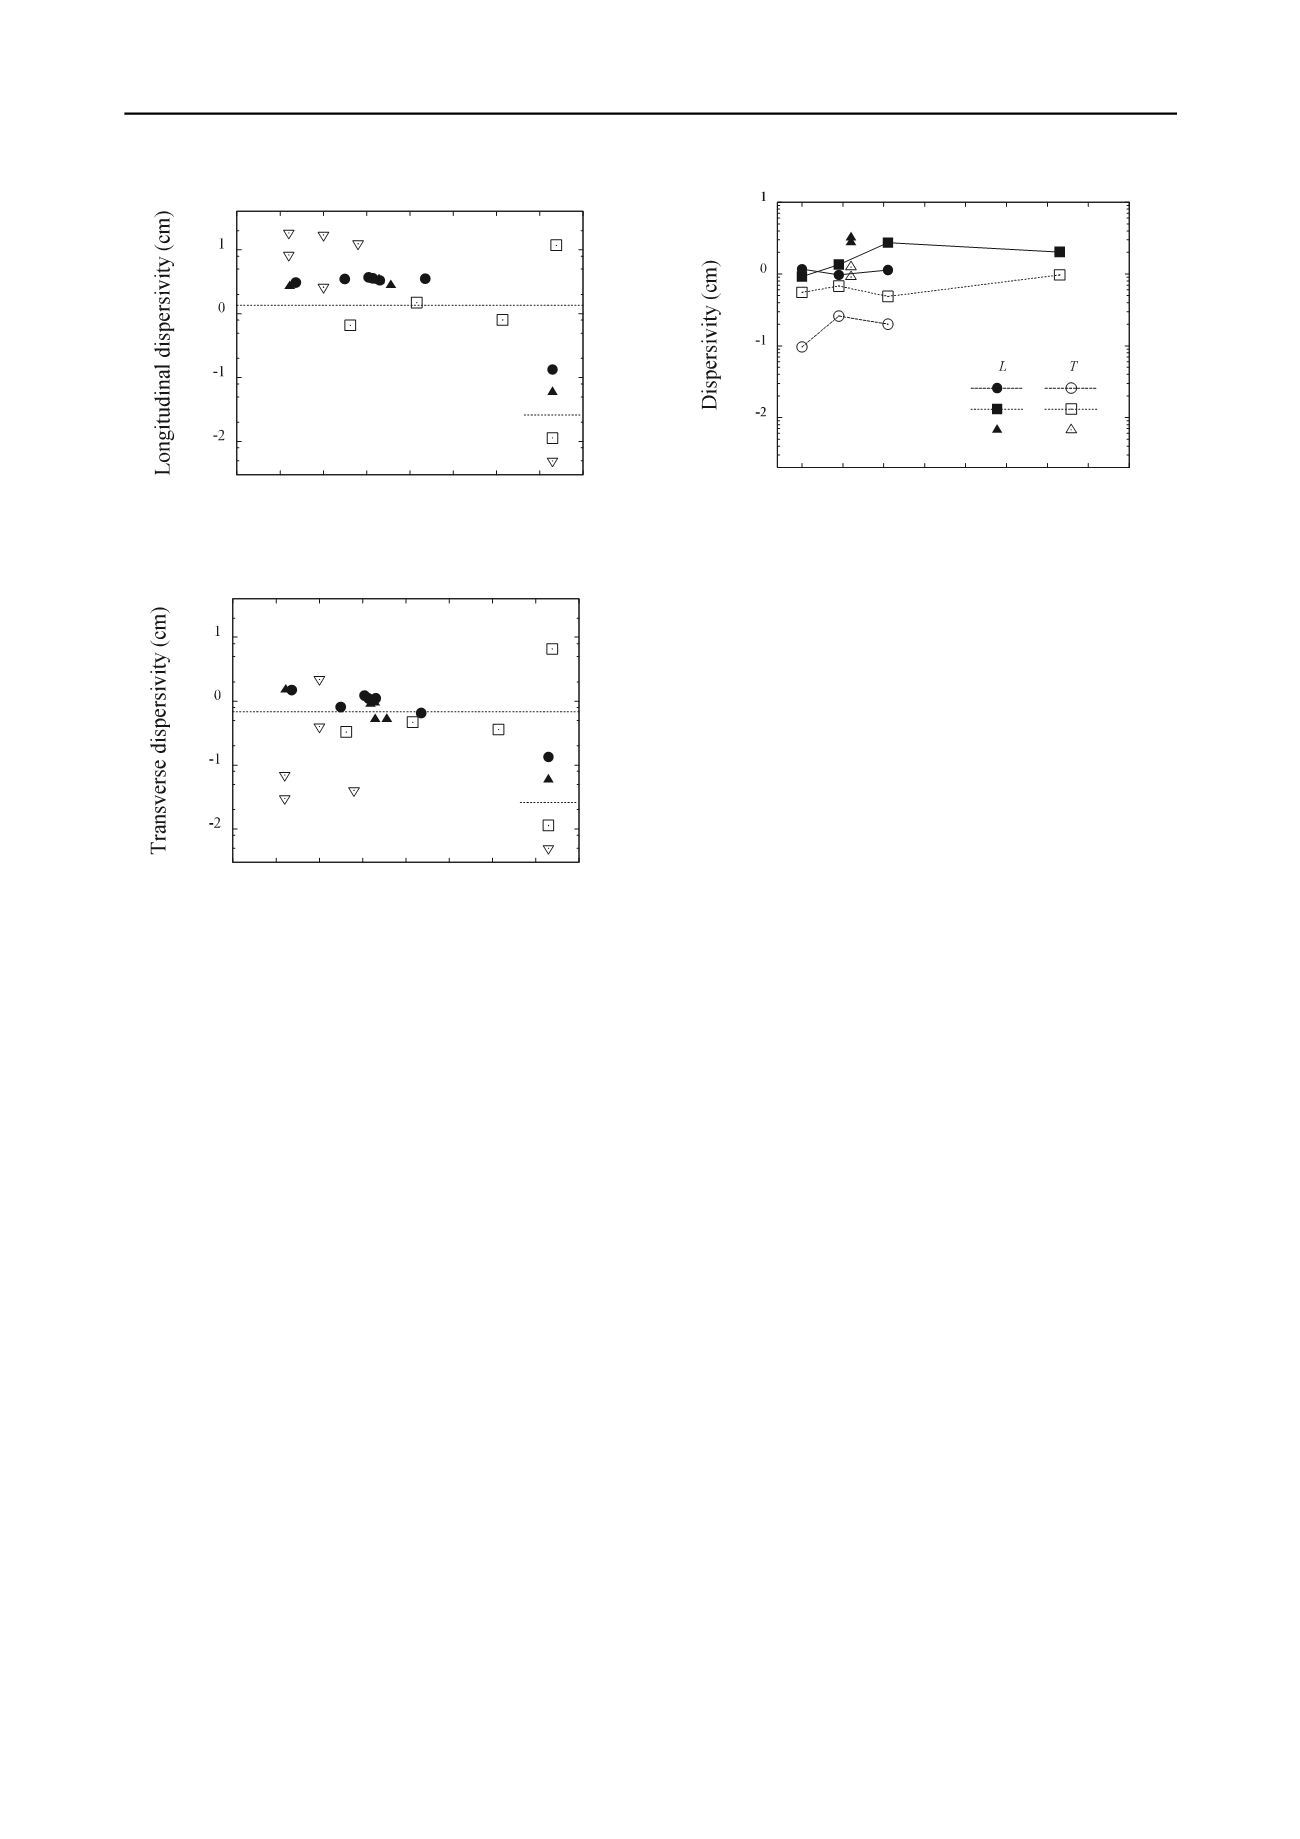
Figure 7 shows the relation between the applied rainfall
intensity and the dispersivity estimates in the field as well as in
the laboratory. Mean values in each experiment are plotted in
this figure. Despite of the rainfall intensity, both dispersivities
remain constant. This is attributed to a relatively low degree of
heterogeneity in the field of concern, while homogeneous
packing of soil in the laboratory was reflected as a less variation
of dispersivity estimates.
5 CONCLUSIONS
In the present study, a new methodology using spatial moment
analysis linked with image processing of a dye tracer behavior
was developed to estimate dispersivities not only in longitudinal
but in transverse directions. Laboratory and field tracer
experiments under unsaturated flow conditions were conducted
with dye, Brilliant Blue FCF. Dispersivities exhibited an
increasing and decreasing tendency associated with water
content and showed a dependency on infiltration rates.
Laboratory and field studies were extended by a literature
search to compare the new results with earlier work,
demonstrating a good agreement between the experimental and
published results. Experimental results indicated the
effectiveness of the developed methodology for simultaneous
assessment of transverse and longitudinal dispersion in
unsaturated soils in a field as well as in a laboratory.
6 ACKNOWLEDGEMENTS
The authors thank Mr. K. Suzuki for valuable discussion and
Mr. H. Watanabe for giving us the permission to conduct the
tracer experiments in his maize fields. The work reported here
was supported by JSPS Grant-in-Aid for Young Scientists (B).
7 REFERENCES
Vanderborght J. and Vereecken H. 2007. Review of dispersivities for
transport modeling in soils,
Vadose Zone J
., 6, 29-52.
McNeil J.D., Oldenborger G.A. and Shincariol R.A. 2006. Quantitative
imaging of contaminant distributions in heterogeneous porous
media laboratory experiments,
J. Contam. Hydrol
., 84, 36-54.
Flury M. and Flühler H. 1995. Tracer characteristics of Brilliant Blue
FCF,
Soil Sci. Soc. Am. J
., 59(1), 22-27.
Forrer I. Kasteel R., Flury M. and Flühler H. 1999. Longitudinal and
lateral dispersion in an unsaturated field soil,
Water Resour. Res.
,
35(10), 3049-3060.
van Genuchten M.Th.1980. A closed-form equation for predicting the
hydraulic conductivity of unsaturated soils,
Soil Sci. Soc. Am. J.
, 44,
892-898.
Tompson A.F.B. and Gelher L.W. 1990. Numerical simulation of solute
transport in three-dimensional, randomly heterogeneous porous
media,
Water Resour. Res
., 26(10), 2541-2562.
Abbasi F., Simunek J., Feyen J., van Genuchten M.Th. and Shouse P.J.
1995. Simultaneous inverse estimation of soil hydraulic and solute
transport parameters from transient field experiments:
homogeneous soil,
Trans. ASAE
, 46(4), 1085-1095.
Persson M. and Berndtsson R. 2002. Transect scale solute transport
measured by time domain reflectometry,
Nord. Hydrol.
, 33, 145-
164.
Figure 5. Longitudinal dispersivity estimates with distance.
Figure 7. Relation between rainfall intensity and dispersivity
estimates.
Figure 6. Transverse dispersivity estimates with distance.
10
10
10
10
0 0.1 0.2 0.3 0.4 0.5 0.6 0.7 0.8
Rainfall intensity (mm/min)
Silica
Andisol
Field
10
10
10
10
0 5 10 15 20 25 30 35 40
Displacement distance (cm)
Field exp.
Plot 1
Plot 2
Laboratory
Forrer et al. (1999)
Abbasi et al. (2003)
10
10
10
10
0 5 10 15 20 25 30 35 40
Displacement distance (cm)
Field exp.
Plot 1
Plot 2
Laboratory
Forrer et al. (1999)
Abbasi et al. (2003)


