3035
Technical Committee 215 /
Comité technique 215
2
00
02
00
11
00
11
2
00
20
c
c c
c c
c
zz
zx
xz
xx
ij
z
M
M xz
M
M
zx
M
M x
M
M
σ
σ
(4)
where
ij
is the second order spatial moments.
Longitudinal and transverse dispersivities from spatial
moments of the distributed tracer plume are calculated as the
following equations (5) and (6) under saturated and unsaturated
conditions, respectively.
c
zz
T
c
xx
L
2
1
,
2
1
(5)
c
xx
T
c
zz
L
2
1
,
2
1
(6)
where
L
is the longitudinal dispersivity,
T
is the transverse
dispersivity and
c
is the travel distance of the center of tracer
plume in the mean flow direction at a given time
t
.
3 DISPERSIVITY IN LABORATORY
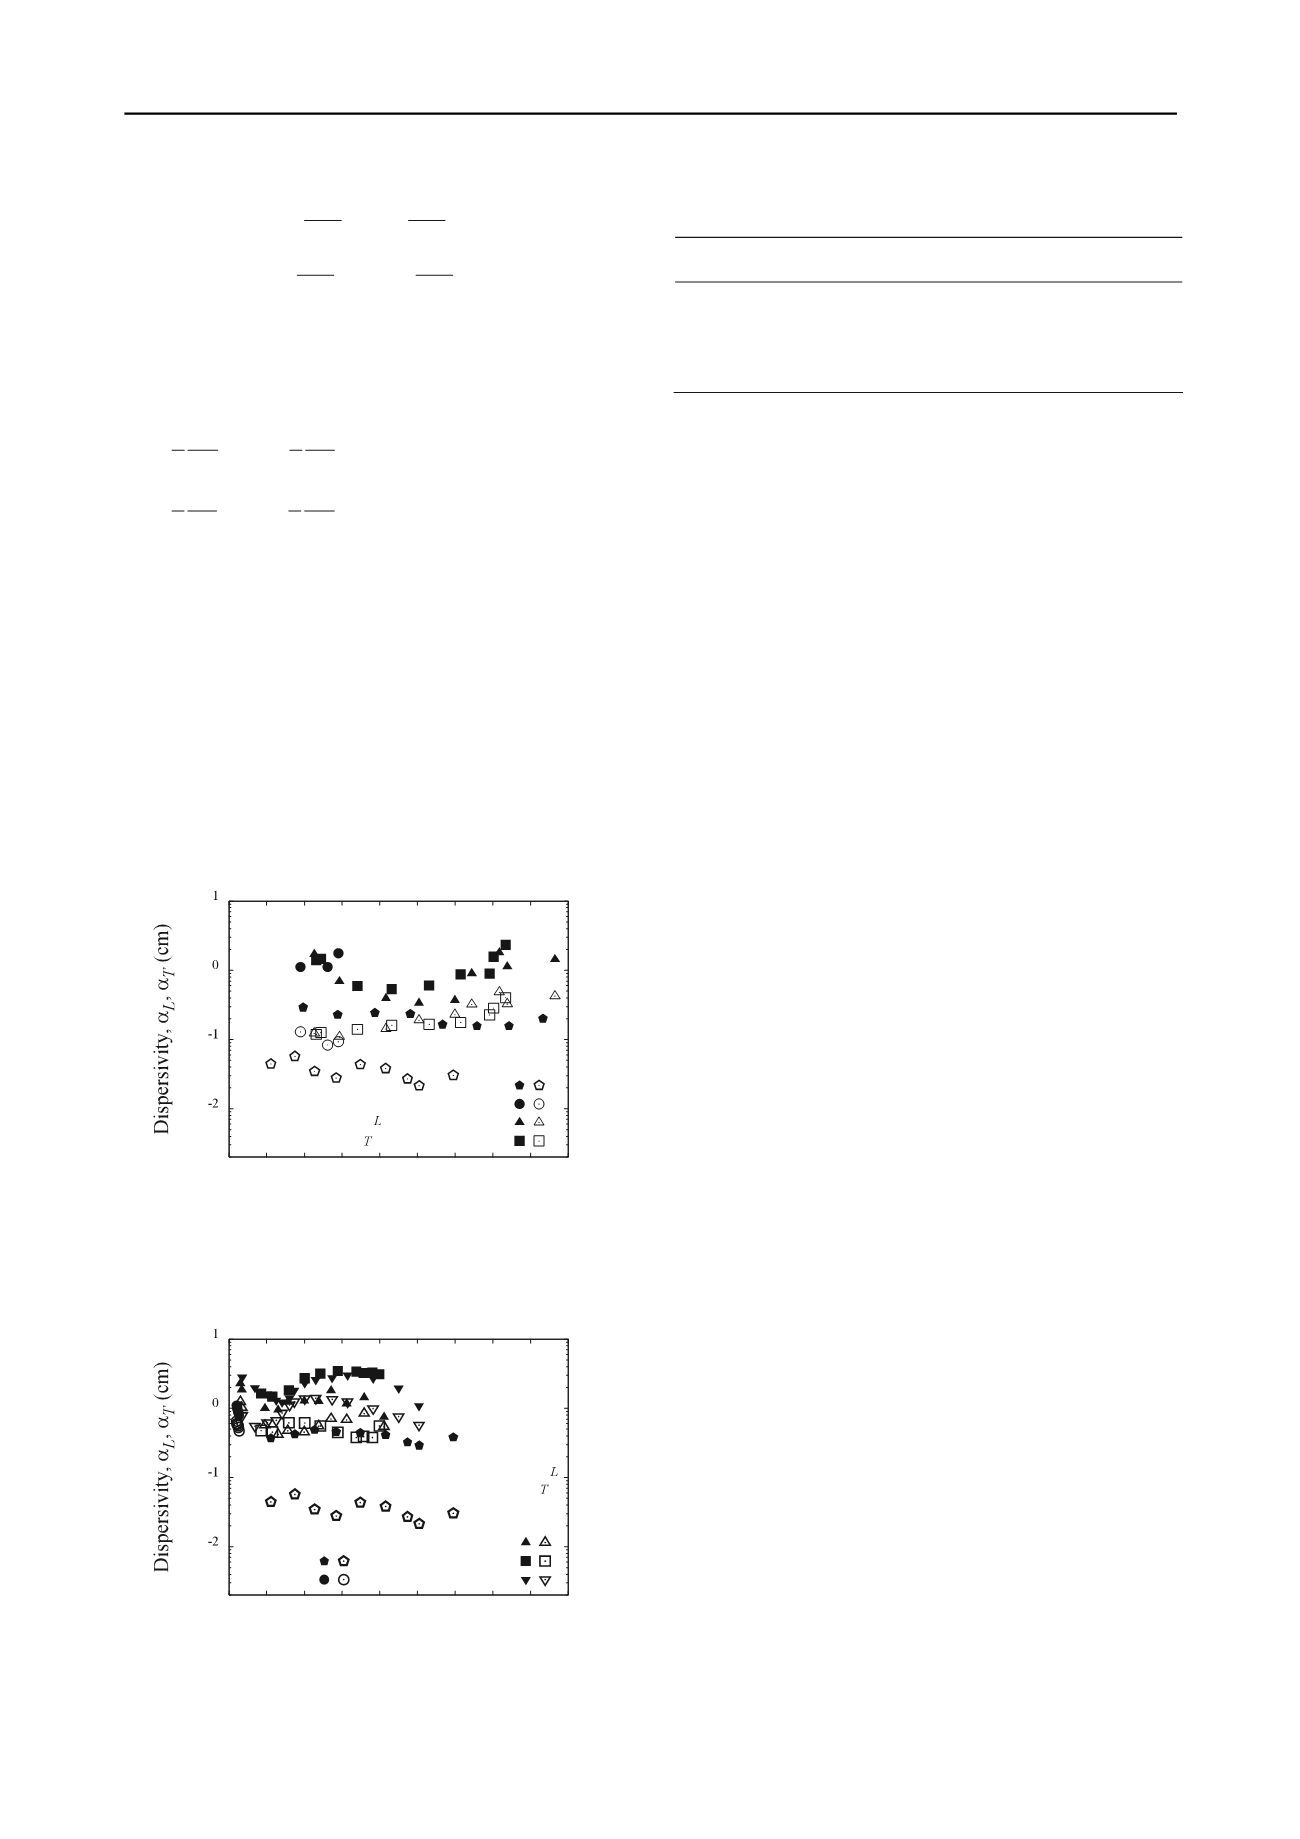
3.1 Longitudinal dispersivity
The results of longitudinal and transverse dispersivities as a
function of travel distance for silica sand and Andisol are shown
in Figures 3 and 4, respectively. Longitudinal dispersivity
estimates under unsaturated conditions are larger than those
under saturated conditions. The increase of dispersivity may be
induced from diversity of solute movement due to the effect of
air. Several studies have pointed out the same tendency in
unsaturated soils (Vanderborght and Vereecken, 2007).
Table 3. Soil properties in maize field.
Depth from the ground surface
20 cm
50 cm
Dry density (g/cm
3
)
0.95
1.13
Mean diameter of particle (cm)
0.021
0.10
Uniformity coefficient (-)
23.7
85.7
Hydraulic conductivity (cm/s)
0.00884
0.0239
Porosity (-)
0.59
0.57
Longitudinal dispersivity estimates also exhibit an
increasing and decreasing tendency and show a dependency on
infiltration rates. Water applied to the ground surface infiltrates
and reaches an upper part of dye tracer. Because flow velocity is
larger than solute velocity in unsaturated zone and affects the
change of tracer migration, shape of dye tracer distribution is
shrunk longitudinally. This duration may correspond to the
decreasing process of the longitudinal dispersivity. After water
reaches a front of dye tracer, dye tracer migrates with interstitial
water. However, part of dye tracer has relatively low velocities
due to the effect of air. Therefore, shape of dye tracer extends
longitudinally, leading to the increase of longitudinal
dispersivity estimates. Similar tendency can be seen in Andisol
in Figure 4. A difference of the longitudinal dispersivity
estimates between silica sand and Andisol is attributed to the
difference of the uniformity coefficient.
3.2 Transverse dispersivity
Figure 3. Longitudinal and transverse dispersivity estimates
with displacement distance in silica sand.
As for Figures 3 and 4, transverse dispersivity slightly increases
under unsaturated conditions or remains constant under
saturated conditions with displacement distance. It is inferred
that transverse solute displacement depends largely on mixing
of water and air whose distribution varies with the depth. The
degree of increase of water content induced from rainfall
application decreases as rainfall intensity is lower. Since
diversity of solute movement pathway in porous media
increases at lower saturation this process would make mobile
region of water complicated and result in larger values for
longitudinal dispersivity. Hence, transverse dispersion
phenomenon under unsaturated conditions is clearly different
from longitudinal dispersion phenomenon.
4 DISPERSIVITY IN A FIELD
4.1 Experimental setup
Developed methodology for quantifying transverse and
longitudinal dispersivities was applied to a maize field soil with
approximately 100 cm depth from the ground surface under
water-unsaturated conditions. Soil cores were taken at the depth
of 20 cm and 40 cm. Physical properties are shown in Table 3
and water characteristic curves are also shown in Figure 2.
Brilliant Blue FCF tracer of 1000 cm
3
with the initial
concentration of 2.0 mg/cm
3
was leached into the ground
surface from two line sources (referred to as Plot 1 and 2) with
65 cm length and 3cm depth and subsequent tracer distributions
were photographically recorded at vertical soil profiles
excavated perpendicular to the line source. Artificial rainfall
intensity was set to 0.12 mm/min for the application duration of
15 minutes. At a site near Plot 1 and 2, the two relations
between the dye concentration and the pixel intensity at the
upper and lower zones, which are 3 cm to 40 cm and are 40 cm
to 80 cm below the ground surface, respectively, were obtained
over the range of 0 mg/cm
3
to 2mg/cm
3
. In a similar manner to
laboratory tracer experiments, transverse and longitudinal
dispersivities were quantified using spatial moments and image
processing techniques.
Figure 4. Longitudinal and transverse dispersivity estimates
with displacement distance in Andisol.
10
10
10
10
Silica sand
Closed symol:
Case S-S
Case S-1
Case S-2
Open symol:
Case S-3
0 5 10 15 20 25 30 35 40 45
Displacement distance (cm)
10
10
10
10
Andisol
Closed symol:
0 5 10 15 20 25 30 35 40 45
Displacement distance (cm)
Open symol:
Case A-S
Case A-1
Case A-2
Case A-3
Case A-4


