3030
Proceedings of the 18
th
International Conference on Soil Mechanics and Geotechnical Engineering, Paris 2013
respectively. Based on these two parameters, the clay samples
were classified as saline-alkali soils (Richards 1954).
Sample preparation for the hydraulic conductivity testing
involved moisture conditioning with saline CSG water (CW)
and deionised water (DW), and compaction to 90%, 95%, 98%
and 100% of the maximum dry densities (MDD) at the optimum
moisture contents (OMC) and at a nominal 3% wet of the
optimum moisture contents (wet of OMC), based on the
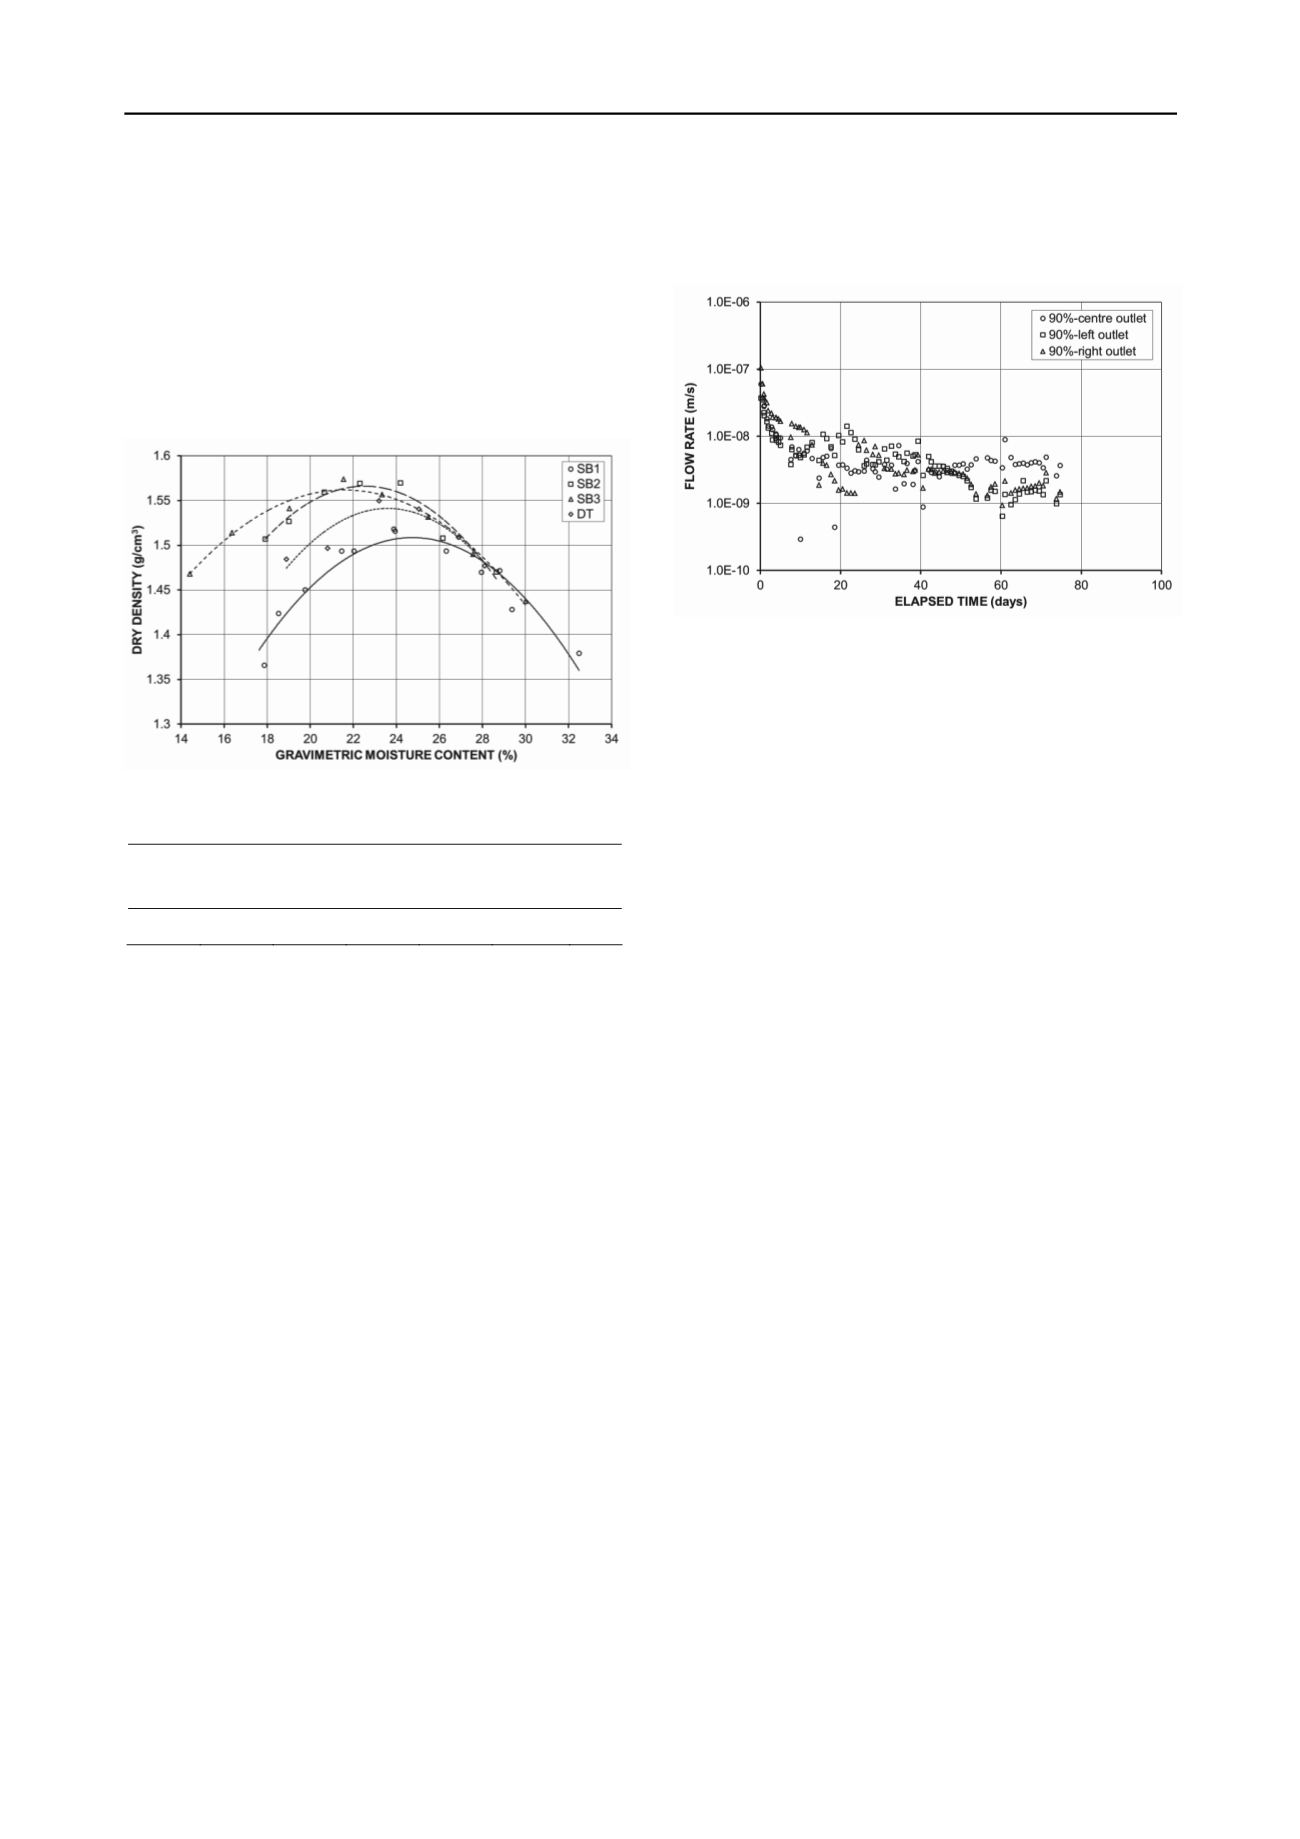
compaction curves shown in Figure 1. The concentrations of the
major ions, EC, and pH of the CW are presented in Table 2.
Figure 1. Compaction curves for clay samples.
Table 2. Chemistry of saline CSG water.
Cl
-
(mg/l)
Na
+
(mg/l)
Mg
2+
(mg/l)
Ca
2+
(mg/l)
K
+
(mg/l)
EC
(dS/m)
pH
789 1484
11
8
8
5.8
9.6
3 HYDRAULIC CONDUCTIVITY TESTING
3.1
Compaction mould testing
Specimens were compacted to the specified dry density at the
specified moisture content in a 144 mm diameter by 130 mm
high modified compaction mould permeameter. The initial
height of each compacted specimen was limited to 50 mm, to
allow space for the specimen to swell to its maximum capacity,
as would occur in the field. Prior to a test, no attempt was made
to saturate the specimen, simulating the field condition in which
a clay liner will not be fully saturated prior to the ponding of
CSG water. A 100 kPa constant water pressure was gradually
applied to top of the specimen to simulate a 10 m deep pond of
CSG water.
To minimise bypass flow along the wall of the permeameter
under the high applied hydraulic gradient of 200, a well-graded
sand was glued to the wall to roughen its surface. The
effectiveness of the sand coating in preventing bypass flow was
verified by conducting hydraulic conductivity tests under a
100 kPa constant water pressure using CW applied to SB1
mixed with CW and compacted to 90% of the MDD at OMC,
and 95% of MDD wet of OMC. A 101.9 mm diameter by 5 mm
thick sharp-edged divider ring was installed centrally on top of
the base plate, on which a 3 mm thick medium sand layer was
placed to act as a drainage layer. The divider ring had an area of
about 50% of the open permeameter area and penetrated about
2 mm into the base of the compacted clay specimen. In addition
to an outlet located at the centre of the base plate, two outer
outlets between the permeameter wall and the edge of divider
ring were provided. The flow rates from each of the outlets were
calculated assuming vertical only flow. The measured flow rates
from each of the outlets for the 90% MDD at OMC specimen
are shown in Figure 2, in which there are no appreciable
differences between the central and outer flow rates, indicating
that the roughened permeameter wall was effective in
minimising bypass flow. A similar result was obtained for the
95% MDD wet of OMC specimen.
Figure 2. Flow rates from centre and outer outlets during testing of 90%
MDD at OMC specimen with roughened permeameter wall.
A set of hydraulic conductivity tests was conducted on SB3
compacted to 90% of the MDD at the OMC, 95% of MDD at
OMC and wet of OMC, 98% of MDD at OMC and wet of
OMC, and 100% of MDD at OMC, to study the effects of dry
density and moulding moisture content on hydraulic
conductivity. Another set of hydraulic conductivity tests was
conducted on all samples compacted to 95% of MDD wet of
OMC, and mixed and permeated with DW and CW, to
investigate the effects of moulding and permeating water type
on hydraulic conductivity. These dry densities and moisture
contents were selected because the clays in the field are usually
compacted to 95% of MDD wet of OMC.
It was expected that moisture conditioning wet of the OMC
would show significant differences in the compacted hydraulic
conductivity compared to that following moisture conditioning
to the OMC, since additional water would be available to fill the
initially air-dried voids. The permeameter tests were terminated
once a relatively constant flow rate and salt concentration of the
outflow had been achieved. The EC and pH values of the
outflows were measured using a portable EC-pH meter, while
concentrations of major anions (Cl
-
) and cations (Na
+
, Mg
2+
,
Ca
2+
and K
+
) were measured using inductively-coupled plasma
and inductively-coupled plasma-optical emission spectrometry
methods, respectively.
3.2
Oedometer testing
Oedometer tests were conducted on standard 76 mm diameter
by 20 mm thick compacted specimens mixed with and in a
water bath of CW or DW. Each specimen was subjected to
incremental applied stresses of 10 kPa, 50 kPa, 100 kPa and
150 kPa, from which data the coefficients of consolidation and
coefficients of volume decrease, and hence hydraulic
conductivities, were calculated. During the tests, the oedometer
cells were covered with Glad wrap to prevent any change in the
salt concentration or pH of the water bath due to evaporation.
4 TEST RESULTS AND DISCUSSION
4.1
Compaction mould hydraulic conductivity
The measured hydraulic conductivities of all compacted SB3
specimens are shown in Figure 3. Figure 3 shows that
specimens compacted to 90% of MDD at OMC tend to have the
highest hydraulic conductivities, while specimens compacted to
100% of MDD at OMC and 98% of MDD wet of OMC tend to
have the lowest hydraulic conductivities. Comparing the data
for specimens compacted at 98% and 95% of MDD, it appears


