3020
Proceedings of the 18
th
International Conference on Soil Mechanics and Geotechnical Engineering, Paris 2013
Proceedings of the 18
th
International Conference on Soil Mechanics and Geotechnical Engineering, Paris 2013
From Figure 4 we can observe the whole domain distribution
of N-decane at the end of each stage, and it is clear how a light
NAPL can actually get trapped below the water table after
subsequent drainage and imbibition processes. We can also
observe and quantify how less N-decane penetrated the column
after the second drainage process, when compared to the first
drainage process, mostly due to loss of NAPL trough the top
spillway during imbibition. When comparing the depth and
infiltration initial speed of the five studied NAPLs, no
relationship was found with either density or viscosity values.
More studies are necessary to compare these migration
parameters with other physical properties of NAPLs. Finally,
we can also observe how regions within the column that had
higher NAPL saturation values at the end of the drainage
processes, had also high saturation values by the end of the
imbibition. This behavior was found on all five NAPLs, as
shown in Figure 5 (left).
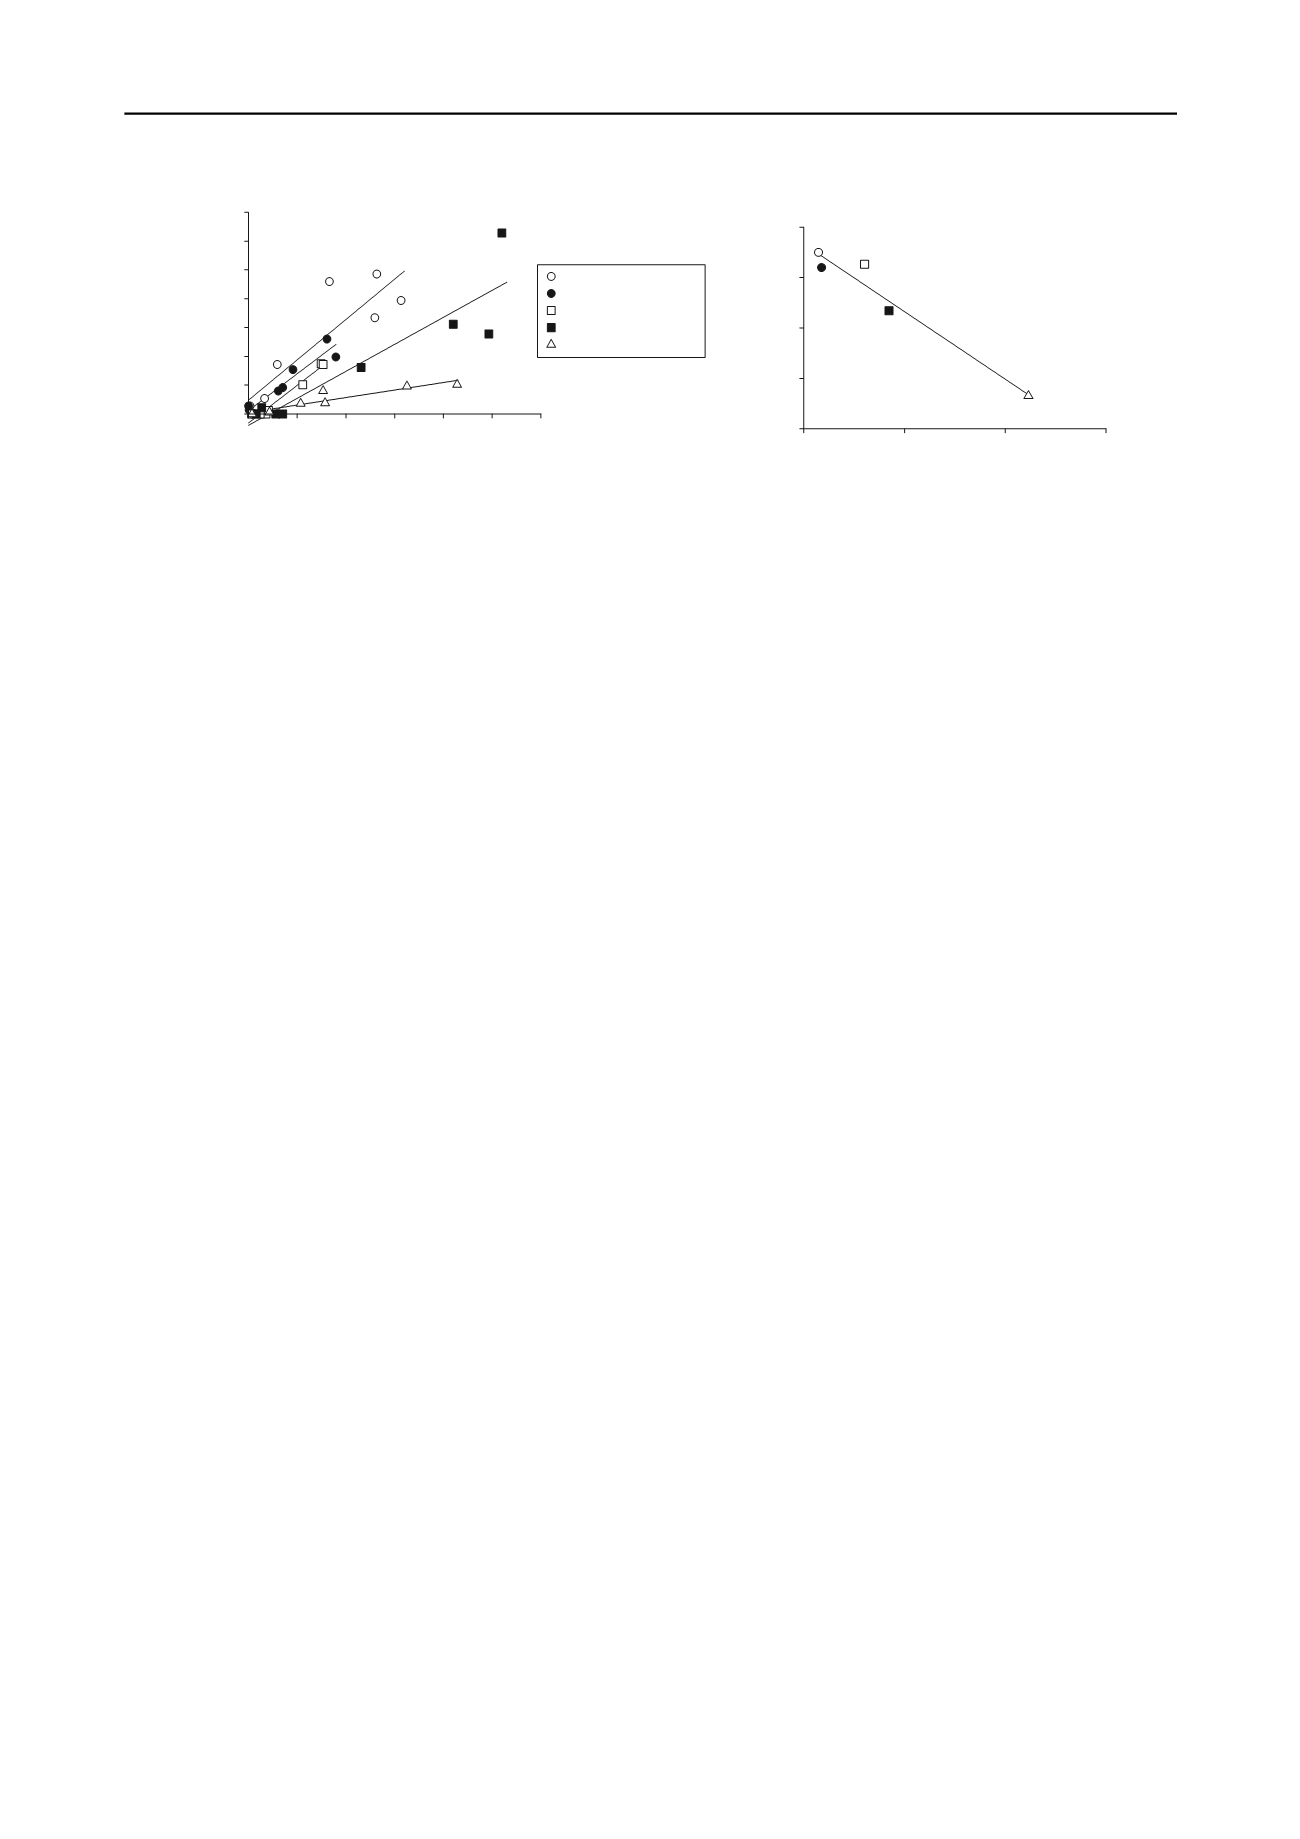
Figure 5 (left) shows, for each one of the five different
studied NAPLs, the relationship between their residual
saturation values at the end of the drainage stage, when
compared to their residual saturation values at the end of the
imbibition stage. As can be seen, the relationship between both
values is linear for each NAPL, and the general ratio of
imbibition over drainage is less than 1.0 for all NAPLs, which
confirms that some contaminant is removed by water during the
imbibition stages. It can also be noticed how the residual
saturation ratio (imbibition/drainage) is different for each
NAPL, and follows the progression (from larger to smaller) N-
decane > Ethylbenzene > Diesel 2 > Low Viscosity Paraffin >
Paraffin Liquid, which is their exact inverse order when
comparing their viscosity values. In fact, if we plot viscosity
versus residual saturation ratio, we will find a logarithmic
relationship between them (Figure 5, right), which could help us
predict the residual saturation of any NAPL after imbibition
processes, if the residual saturation after the drainage process is
known. Additional NAPLs need to be tested to improve the
accuracy of this relationship.
7 CONCLUSIONS
We have confirmed that the relationship between Optical
Density (
D
i
) and water and LNAPL saturation values (
S
w
and
S
o
) is approximate linear, as predicted by the
Beer-Lambert Law
of Transmittance
, for ten different NAPLs with very different
density and viscosity values (0.73 ≤ ρ ≤ 1.20 g/cm
3
; 1.4 ≤ ν ≤
1000 mPa∙s). Due to this finding, the
Simplified Image Analysis
Method
can be safely used to assess water and NAPL saturation
distributions in porous media subject to dynamic conditions, for
a broad range of NAPLs. In our research, we applied this
method to study the behavior of five different NAPLs in
experimental columns subject to drainage and imbibition
processes, and confirmed that light NAPLs can effectively get
trapped below the water table, despite their lower than water
density values. We also found a logarithmic relation between
viscosity and residual saturation ratios of different NAPLs that
will help us predict their residual saturation values after
imbibition processes, when their respective value after drainage
processes are known. In the next step of this study, additional
NAPLs will be tested to improve the accuracy of this
relationship.
8 REFERENCES
Australia DSEWPC. 1999. Substance list and thresholds: National
pollutant inventory. Retrieved 01/02/2012, from
npi.gov.au/substances/list-of-subst.html.
Capiro, N. L., Stafford, B. P., Rixey, W. G., Bedient, P. B. and Alvarez,
P. J. J. 2007. Fuel-grade ethanol transport and impacts to
groundwater in a pilot-scale aquifer tank.
Water Research
41(3):
656-664.
Environment Canada. 2010. National pollutant release inventory.
Canada Gazette
. 144.50: 3112-3142.
Fagerlund, F., Illangasekare, T. H. and Niemi, A. 2007. Nonaqueous-
phase liquid infiltration and immobilization in heterogeneous
media: 1. Experimental methods and two-layered reference case.
Vadose Zone J
6(3): 471-482.
Flores, G., Katsumi, T., Inui, T. and Kamon, M. 2011. A simplified
image analysis method to study LNAPL migration in porous media.
Soils and Foundations
51(5): 835-847.
Kechavarzi, C., Soga, K. and Wiart, P. 2000. Multispectral image
analysis method to determine dynamic fluid saturation distribution
in two-dimensional three-fluid phase flow laboratory experiments.
Journal of Contaminant Hydrology
46(3-4): 265-293.
Lenhard, R. J. and Parker, J. C. 1987. Measurement and prediction of
saturation-pressure relationships in three-phase porous media
systems.
Jnl. of Contaminant Hydrology
1(4): 407-424.
Mercer, J. W. and Cohen, R. M. 1990. A review of immiscible fluids in
the subsurface: Properties, models, characterization and
remediation.
Journal of Contaminant Hydrology
6(2): 107-163.
Skoog, D. A., Holler, F. J. and Crouch, S. R. 2007.
Principles of
instrumental analysis
. Belmont, CA, Thomsom Brooks/Cole.
UK Environment Agency. 2011. Pollution inventory substances:
Pollution inventory. Retrieved 01/02/2012, from
environment-agency.gov.uk/pi.
US EPA. 2011. Toxics release inventory (TRI): Toxic chemical list.
Retrieved 01/02/2012, from
/
index.htm.
0
10
20
30
40
50
60
0
5
10
15
20
25
30
35
NAPL saturation at the end of drainage stage (%)
NAPL saturation at the end of
imbibition stage (%)
N-decane
Ethylbenzene
Diesel 2
Low Viscosity Paraffin
Paraffin Liquid
=
1
.4
m
P
a
·s
=
1
.5
=
4
=
7
=
1
7
0
1
10
100
1000
0
0.2
0.4
0.6
0.8
Viscosity
(mPa·s)
Residual saturation ratio
(imbibition/drainage)
Figure 5. Comparison of residual saturation at the end of drainage and imbibition stages for 5 different NAPLs (left) and relationship between their
viscosity and residual saturation ratio (right)


