3019
Technical Committee 215 /
Comité technique 215
t
= 168 h (no
dye)
t
= 0 h (no dye)
t
= 0 h (dye)
t
= 168 h (dye)
Proceedings of the 18
th
International Conference on Soil Mechanics and Geotechnical Engineering, Paris 2013
of two cameras, two 500 W lights were turned on, and one
picture was taken with each camera (one with a λ = 450 nm
band-
pass filter, and the other one with a λ = 640 nm one). To
account for differences in lighting, a Kodak gray scale and a
Gretamacbeth white balance card were placed next to each soil
sample, and were part of each picture as well. Both cameras
were set to manual mode so that aperture, shutter speed and
white balance were kept constant. Room temperature was kept
at 20 °C and humidity at 70%. Pictures were recorded in NEF
format and then were exported to TIFF format using ViewNX
1.5.0. The TIFF images were then analyzed by an ad-hoc
program written in MATLAB Release 2007a. Graphics were
prepared for each NAPL, comparing water and NAPL
saturation versus optical density values, for each wavelength.
Figure 2 shows the plots corresponding to one of our analyzed
NAPLs, N-decane, for both 450 and 640 nm. The linear fit for
the first graphic (450 nm) has a coefficient of determination
R
2
= 0.89, and for the second one (640 nm),
R
2
= 0.96, showing
that, as predicted by equation (3), the relationship between
water and NAPL saturation, and optical density is linear. The
regression equations and corresponding values for the
coefficients of determination (
R
2
) for the ten studied NAPLs are
as shown in Table 2.
6 COLUMN TESTS
Once linear relationships between water and NAPL saturation
values, and optical density, were confirmed for a broad
spectrum of NAPLs, we can apply the
Simplified Image
Analysis Method
to study the behavior of different NAPLs in
whole domains. Five NAPLs (Diesel 2, Ethylbenzene, Low
Viscosity Paraffin, N-decane, and Paraffin Liquid) were
selected for the column tests based on their diverse viscosity
values (1.4 <
ν
< 170 mPa∙s), and dens
ities (0.730 <
ρ
< 0.880
g/cm
3
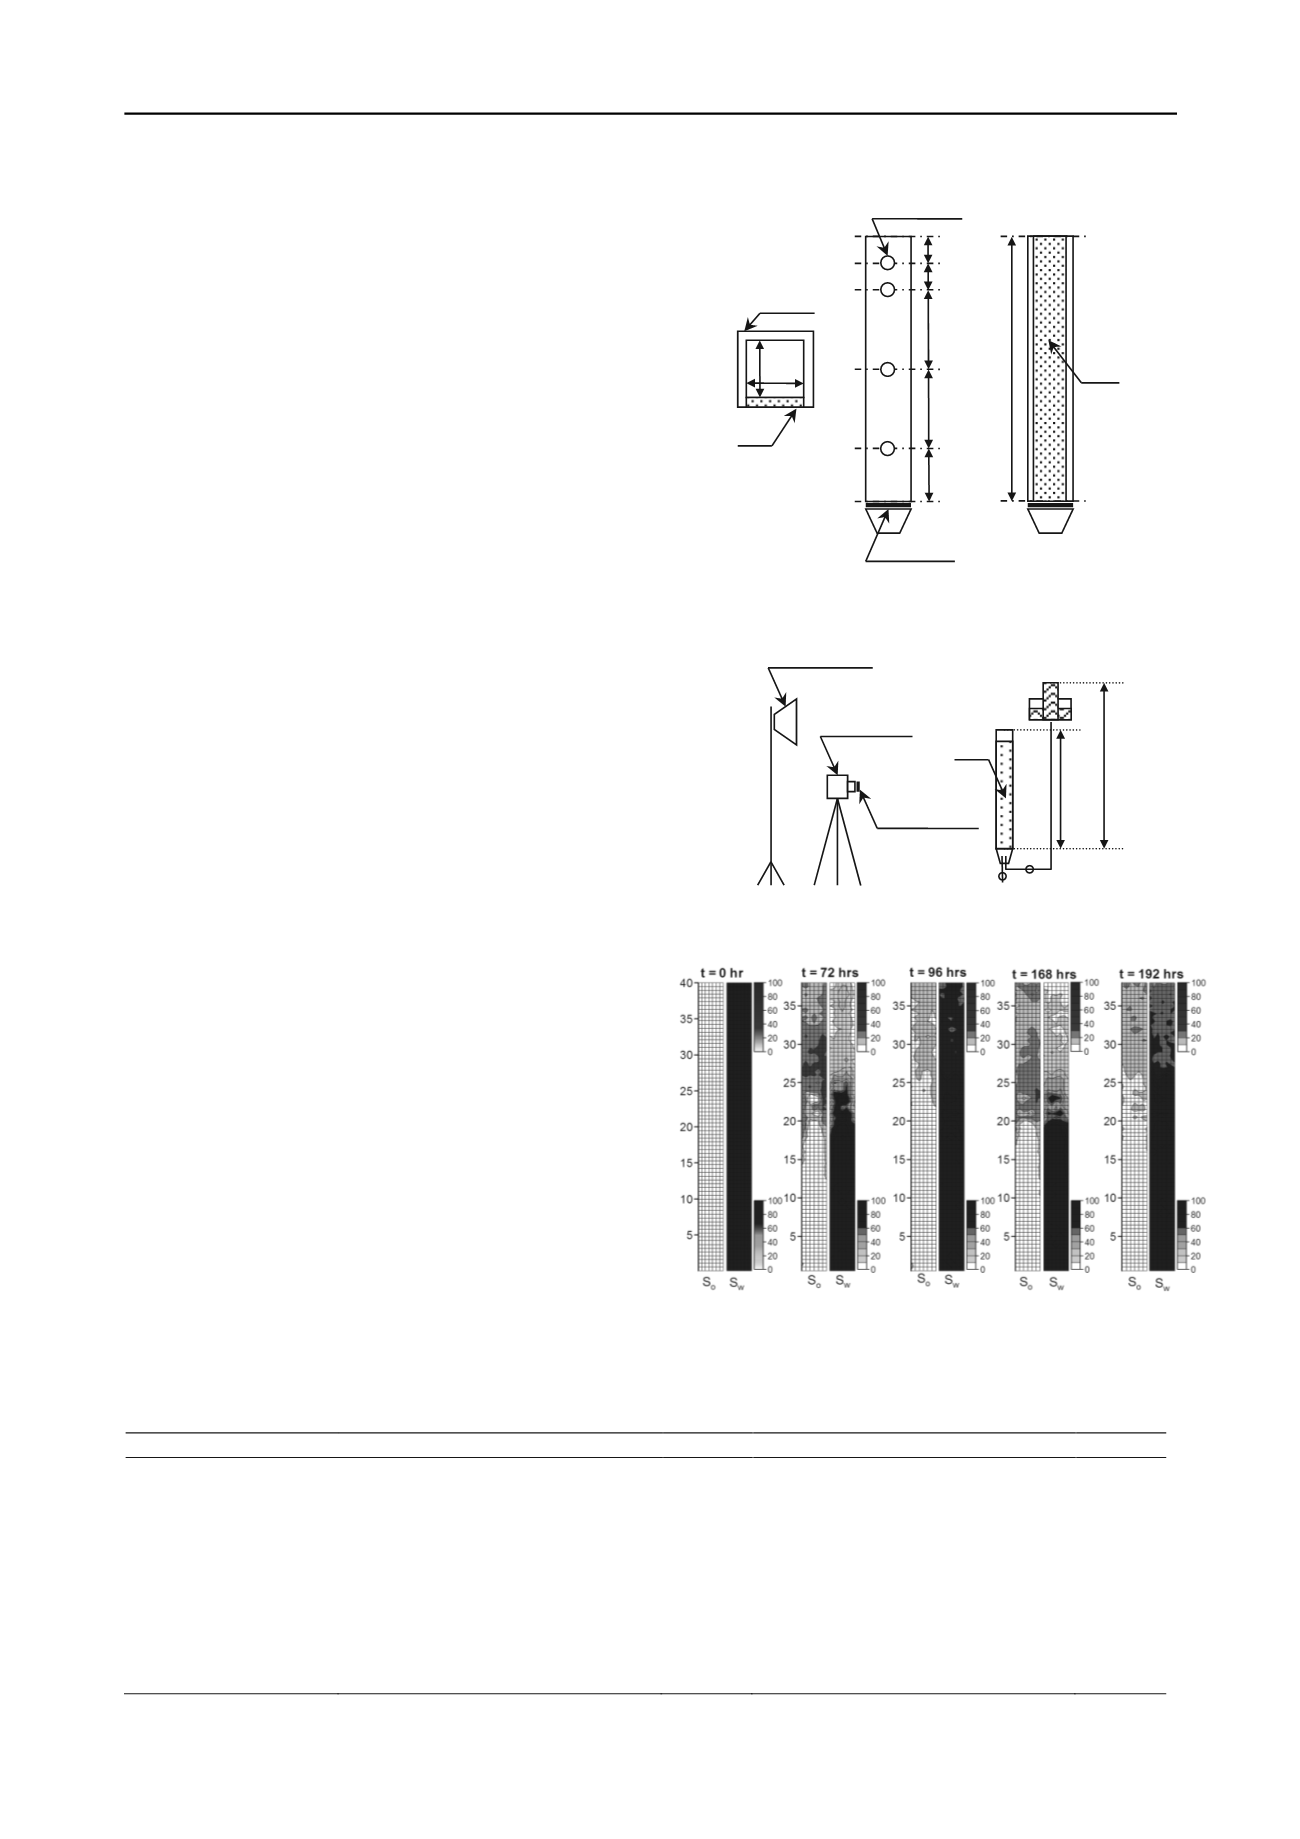
). Similar amount of each NAPL (28 g) was injected from
the top of their corresponding column and subjected to two
cycles of Drainage-Imbibition in separate 3.5 × 3.5 × 40 cm
columns (Figure 3) filled with fully saturated Toyoura Sand.
Both drainage stages lasted 72 hours (
h
= -5 cm), and both
imbibition stages lasted 24 hours (
h
= 40 cm). Total duration of
each test was 192 hours. Two simultaneous pictures were taken
of each column every 30 minutes, and were analyzed following
the
Simplified Image Analysis Method
described in Flores
et al
(2011). Saturation distributions of NAPL and water for the
whole domains were plotted for all cases at
t
= 0, 72, 96, 168,
and 192 hours, representing initial conditions, end of the first
drainage, end of the first imbibition, end of the second drainage,
and end of the second imbibition. Saturation distribution
graphics of N-decane are shown in Figure 4, but similar
graphics were prepared for all NAPLs.
Figure 3. Column design (top) and Experimental setup (bottom)
Figure 4. NAPL (
S
o
) and Water (
S
w
) saturation distribution matrices at
different times, for N-decane
3.5cm
Aluminum
Glass
10cm
15cm
15cm
5cm
5cm
Spillway Ø1cm
Stainless Mesh
50cm
Glass
CROSS SECTION
SIDE VIEW
FRONT VIEW
500W Floodlights
Digital Cameras
Band-Pass Filters
Sand
Water Table
50cm
Variable Height (
h
)
Table 2.
Regression equations for different NAPLs, for wavelengths λ = 450 nm and 640 nm
NAPL
D
450
R
2
D
640
R
2
Diesel 2
0.0180
S
o
+ 0.0035
S
w
+ 0.2457
0.83
0.0030
S
o
+ 0.0025
S
w
+ 0.1283
0.95
Ethylbenzene
0.0175
S
o
+ 0.0007
S
w
+ 0.0680
0.81
0.0033
S
o
+ 0.0037
S
w
+ 0.1220
0.90
Low Viscosity Paraffin
0.0160
S
o
+ 0.0008
S
w
+ 0.0710
0.89
0.0029
S
o
+ 0.0036
S
w
+ 0.1300
0.93
Motor Oil
0.0150
S
o
+ 0.0006
S
w
+ 0.0750
0.91
0.0028
S
o
+ 0.0033
S
w
+ 0.1300
0.92
N-decane
0.0150
S
o
+ 0.0008
S
w
+ 0.0700
0.89
0.0033
S
o
+ 0.0040
S
w
+ 0.1200
0.96
N-dodecane
0.0160
S
o
+ 0.0007
S
w
+ 0.0700
0.88
0.0030
S
o
+ 0.0035
S
w
+ 0.1300
0.95
NEOVAC
0.0140
S
o
+ 0.0008
S
w
+ 0.0700
0.85
0.0025
S
o
+ 0.0036
S
w
+ 0.1300
0.95
Nitrobenzene
0.0130
S
o
+ 0.0007
S
w
+ 0.0730
0.85
0.0026
S
o
+ 0.0036
S
w
+ 0.1300
0.94
Paraffin Liquid
0.0140
S
o
+ 0.0007
S
w
+ 0.0087
0.88
0.0026
S
o
+ 0.0040
S
w
+ 0.1360
0.96
Silicone Oil
0.0120
S
o
+ 0.0009
S
w
+ 0.0690
0.93
0.0023
S
o
+ 0.0040
S
w
+ 0.1200
0.97


