3018
Proceedings of the 18
th
International Conference on Soil Mechanics and Geotechnical Engineering, Paris 2013
Proceedings of the 18
th
International Conference on Soil Mechanics and Geotechnical Engineering, Paris 2013
where
D
0
is the optical density of a solution of unit
concentration, and
D
t
the optical density of a solution of
concentration
c
. Therefore, when two cameras with band-pass
filters (wavelengths
λ
=
i
and
j
) are used, and when water and
NAPL are mixed with dyes whose predominant color
wavelengths are also
i
and
j
, we can obtain two different sets of
linear equations that can be solved for
S
w
and
S
o
:
[
]
[ (
)
(
)
(
)
(
)
]
(4)
where
m
and
n
are the dimensions of the matrix, [
D
i
]
mn
and
[
D
j
]
mn
are the values of average optical density of each mesh
element for wavelengths
i
and
j
; [
D
i
00
]
mn
and [
D
j
00
]
mn
are the
average optical density of each mesh element for dry sand;
[
D
i
10
]
mn
and [
D
i
10
]
mn
for water saturated sand; and [
D
i
01
]
mn
and
[
D
i
01
]
mn
for NAPL saturated sand. This is the base of the
Simplified Image Analysis Method
.
3 MATERIALS
For this study, 10 NAPLs (Table 1) were used as non-wetting
fluids after being dyed red with Sudan III (1:10000). Their
names were obtained from different national pollutant registry
lists (Australia DSEWPC 1999; Environment Canada 2010; UK
Environment Agency 2011; US EPA 2011) for their frequency
as contaminants, as well as for their immiscibility (or negligible
solubility) in water. Water, dyed blue with Brilliant Blue FCF
(1:10000), was used as wetting fluid. Toyoura sand (Soil
particle specific gravity,
G
s
= 2.64; uniformity coefficient,
C
u
=
1.36) was the porous media.
Table 1. Physical characteristics of NAPLs
NAPL
Solubility
in Water
Density
ρ
(g/cm
3
)
Viscosity
ν
(mPa∙s)
Diesel 2
Immiscible
0.850
4
Ethylbenzene
0.0169 g/l
0.860
1.5
Low Viscosity Paraffin
Immiscible
0.880
7
Motor Oil
Immiscible
0.858
129
N-decane
0.009 ppm 0.730
1.4
N-dodecane
Immiscible
0.750
1.9
NEOVAC
Negligible
0.930
108
Nitrobenzene
0.019 g/l
1.199
3.1
Paraffin Liquid
Immiscible
0.870
170
Silicone Oil
Negligible
0.963 1000
4 TRANSMITTANCE TEST
For equation (3) to truly represent a linear relationship, the
colorimetric characteristics of the solution of concentration
c
(i.e., each NAPL) must not greatly change throughout the test.
To verify that our selected NAPLs satisfy this condition,
samples of each one were analyzed before and after being freely
let evaporate at laboratory conditions.
For every NAPL (Table 1), 50 ml were dyed with Sudan III
(1:10000), their transmittance curves were obtained with the
Shimadzu UV-VIS Spectrometer, and were let evaporate inside
50 ml glass centrifuge tubes (
ø
= 29 mm,
h
= 117 mm) for 168 h
at a constant room temperature of 20˚ C and humidity of 70%,
after which their transmittance curves were once again
calculated.
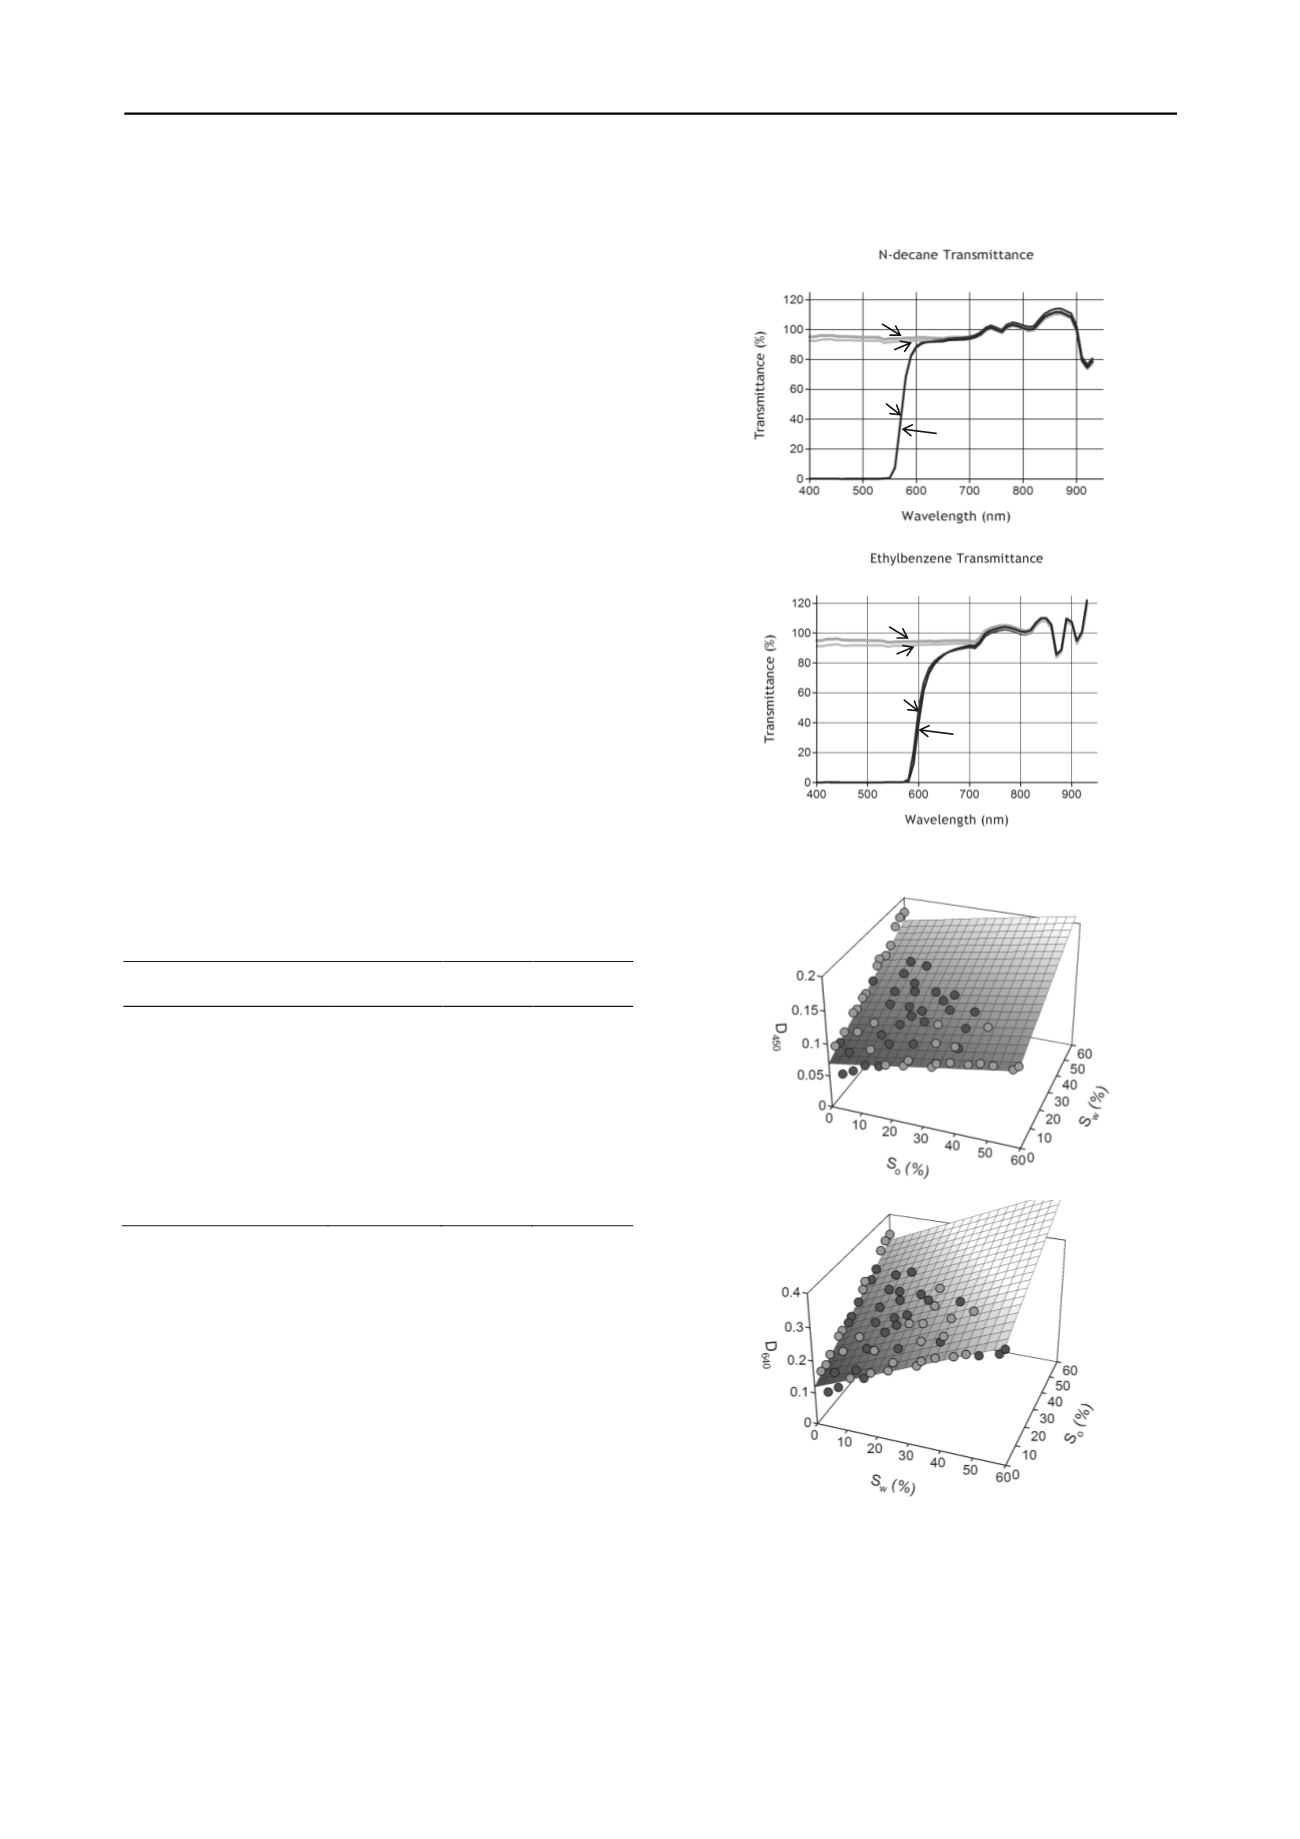
Graphics were prepared comparing transmittance before and
after the 168 h period, for both samples that were dyed and
extra samples that were kept undyed. Results show very little
variation on the transmittance behavior of all NAPLs. As an
example of the obtained results, Figure 1 shows the plots
corresponding to two of our analyzed NAPLs: N-decane and
Ethylbenzene. Similar results were obtained for all other
NAPLs.
Figure 1. Test of Transmittance for N-decane and Ethylbenzene
Figure 2. Water and NAPL Saturation vs. Optical Density Relationship
for N-decane
5 SATURATION VERSUS OPTICAL DENSITY TEST
Sixty soil samples were prepared with each NAPL by mixing
known amounts of water, NAPL and porous media in 25 cm
3
cylindrical sample containers (
ø
= 40 mm,
h
= 20 mm). The
prepared samples were positioned approximately 1.5 m in front
t
= 0 h (no dye)
t
= 168 h (no dye)
t
= 0 h (dye)
t
= 168 h (dye)
t
= 0 h (no dye)
t
= 168 h (no dye)
t
= 0 h (dye)
t
= 168 h (dye)


