3027
Technical Committee 215 /
Comité technique 215
Table 2. Model parameters for drying branches
Parameter WN2 NN1 NN1-20 WNT
a
f
1
358 339
91.3
355
m
f
1
0.678 0.626
0.93
2.01
n
f
1
4.72
5.78
2.23 0.819
S
1
2
15.5 0.974
6.86
15.4
S
2
2
134 114
152 88.1
S
3
2
11.5
13.5
8.74
8.76
ae
3
(kPa)
176 137
46.5
63
r
3
(kPa)
1620 1600
650
5220
1
Fredlund and Xing (1994)
2
Pham and Fredlund (2008)
3
Based on Fredlund and Xing (1994)
Table 3. Model parameters for wetting branches
Parameter WN2 NN1 NN1-20 WNT
a
f
1
218 210
203 100000
m
f
1
1.03
2.19
1.28
11.9
n
f
1
1.28 0.695
1.29
0.368
S
1
2
25.1
21.7
29.6
43.2
S
2
2
74.8
72.2
101
115
S
3
2
8.72
8.12
10.3
6.47
ae
3
(kPa)
78 30.3
66.9
125
r
3
(kPa)
8960 4250
2260 25000
1
Fredlund and Xing (1994)
2
Pham and Fredlund (2008)
3
Based on Fredlund and Xing (1994)
The general shape and trends for the GCL moisture-suction
relationships for the tested GCLs were similar to soils with
discernable air entry and residual moisture characteristics and
hysteresis observed between drying and wetting curves. The
moisture-suction characteristics of as-received WN2 and NN1
were relatively similar, whereas the air entry suction value for
the WNT specimens were lower than WN2 and NN1 for drying
(Table 2) and higher for wetting (Table 3). Residual suction
values for WNT were higher than those for WN2 and NN1
(Tables 2 and 3).
The extent of hysteresis observed for WNT was higher than
that for WN2 and NN1. The similar moisture-suction
relationships of WN2 and NN1 were attributed to the relatively
similar structures of the GCLs. The presence of the geofilm
impacted the response of WNT in line with the observations of
Beddoe et al. (2011) indicating effects of GCL structure on
material behavior.
Hysteresis observed in the tests was quantified for selected
moisture levels for GCLs representing as-received/as-placed,
common field exhumed, and limiting air entry and residual
conditions for NN1 using as-received and wet-dry cycled
conditions (Table 4). Wetting and drying cycles affected
moisture-suction behavior of NN1 (Figures 2 and 4 and Tables
2-4). For drying, air entry and residual suctions decreased with
cycling and for wetting, the opposite trend was observed
(increasing air entry and residual suctions with cycling). The
extent of hysteresis decreased (i.e., less difference between
drying and wetting curves) in response to cycling (Table 4). The
limited level of hysteresis observed for cycled specimens was
consistent with findings reported by Fredlund et al. (2012)
indicating that laboratory water retention tests provide extreme
trends (i.e., bounds of limiting envelope) for wetting and drying
branches of soil water characteristic curves (SWCCs), whereas
in-situ soils are expected to demonstrate less extreme trends
bound within the envelope. The GCL data were observed to be
similar, in that data for the cycled GCLs representing in-service
conditions were generally inside the limiting envelope.
Table 4. Extent of hysteresis between wetting and drying branches
Conditioning Suction
Wetting
Curve
(kPa)
Drying
Curve
(kPa)
Hysteresis
(kPa)
r
4245
1602
266
w=50%
1215
1711
496
w=75%
521
829
308
w=100%
249
591
342
w=125%
118
480
362
No cycles
ae
30.3
137
107
r
2260
650
769
w=50%
1170
815
356
w=75%
577
386
191
w=100%
330
247
83
w=125%
190
178
12
20 cycles
ae
66.9
46.5
55
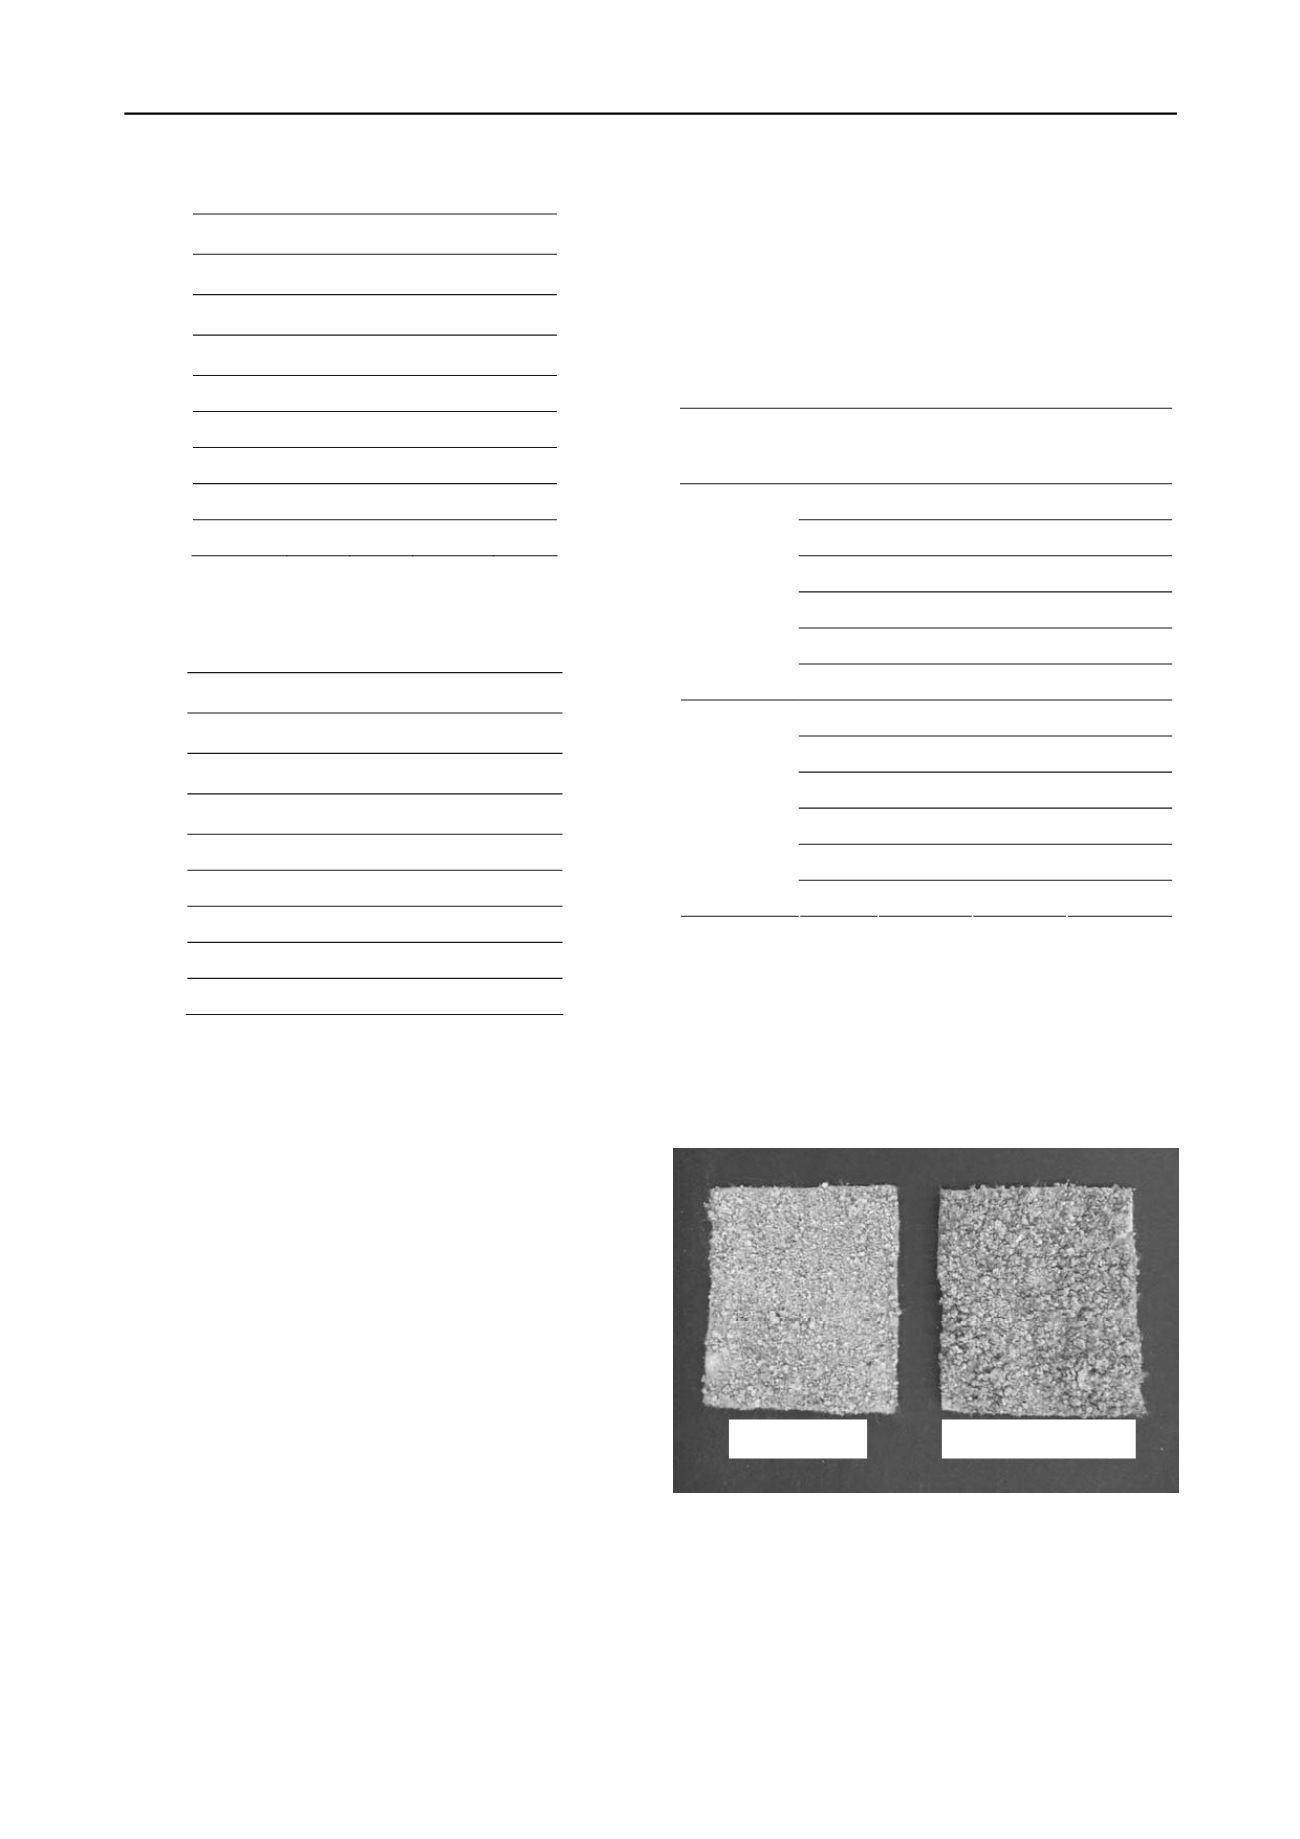
Both macroscopic and microscopic changes occurred in the
bentonite due to wet-dry cycling. On a macroscale, the
agglomerated particles (i.e., granules) became larger in response
to cycling. Grain size distributions of the granules were
determined for as-received and cycled conditions. The percent
retained on a No. 10 (2.0 mm) sieve for the cycled specimens
was 10% greater than the percent retained for the as-received
specimens. A photograph of the exposed bentonite component
for as-received and cycled conditions is presented in Figure 5.
Figure 5 Photograph of exposed bentonite component of the GCLs.
As-Received
20 Wet-Dry Cycles
Selected SEM images of bentonite from GCLs at varying
stages of wet-dry cycles are presented in Figure 6. All images
are presented using the same scale. Variation in the
microstructure of the bentonite was observed in the images. The
baseline (i.e., dispersed fabric) image for bentonite saturated
with DI water (Figure 6a) is consistent with microscopic
analysis of pulverized montmorillonite presented by Egloffstein
(2001). The bentonite became progressively less oriented and
more random with increasing wet-dry cycles. Spaces between
particle agglomerations became visible, in particular for the


