2866
Proceedings of the 18
th
International Conference on Soil Mechanics and Geotechnical Engineering, Paris 2013
0
2
4
6
8
10
12
14
16
SK
SP
SX
SQ
SA
SB
SC
SF
SH
SU
SO
SS
ST
SV
SW
SI
SZ
SG
SR
SD
SE
SM
SN
SY
SJ
SL
Excess grout take (m
3
)
Secondary grout hole
average
Figure 8. Excess grout take versus sequence for secondary grout holes
The excessive grout takes over the average value are by and
large concentrated in areas where a cavity feature had already
been indicated by the "micropile" grouting. Furthermore, it is
clear that the grout take during primary grouting (1.9 m
3
± 3.8
m
3
) compared to the secondary grouting (1.1 m
3
± 2.6 m
3
) is an
indirect confirmation of the success of the grouting scheme.
Excluding the seven values exceeding the average value the
excess grout take is 0.6 m
3
± 0.5 m
3
for primary and 0.4 m
3
±
0.3 m
3
for secondary grout holes compared to the minimum
theoretical grout take of 0.5 m
3
.
The tentative evaluation in terms of cavity feature extent, based
on the combined result in terms of excess grout take, is shown
in Figure 9. The Figure lends credibility to the conclusion that
the horizontal extent of the cavity feature was relatively modest
and close to the hypothetical extent envisaged (Figure 3).
Figure 9. Tentative evaluation of the extent (shading) of the cavity fea-
ture below Pylon P4.
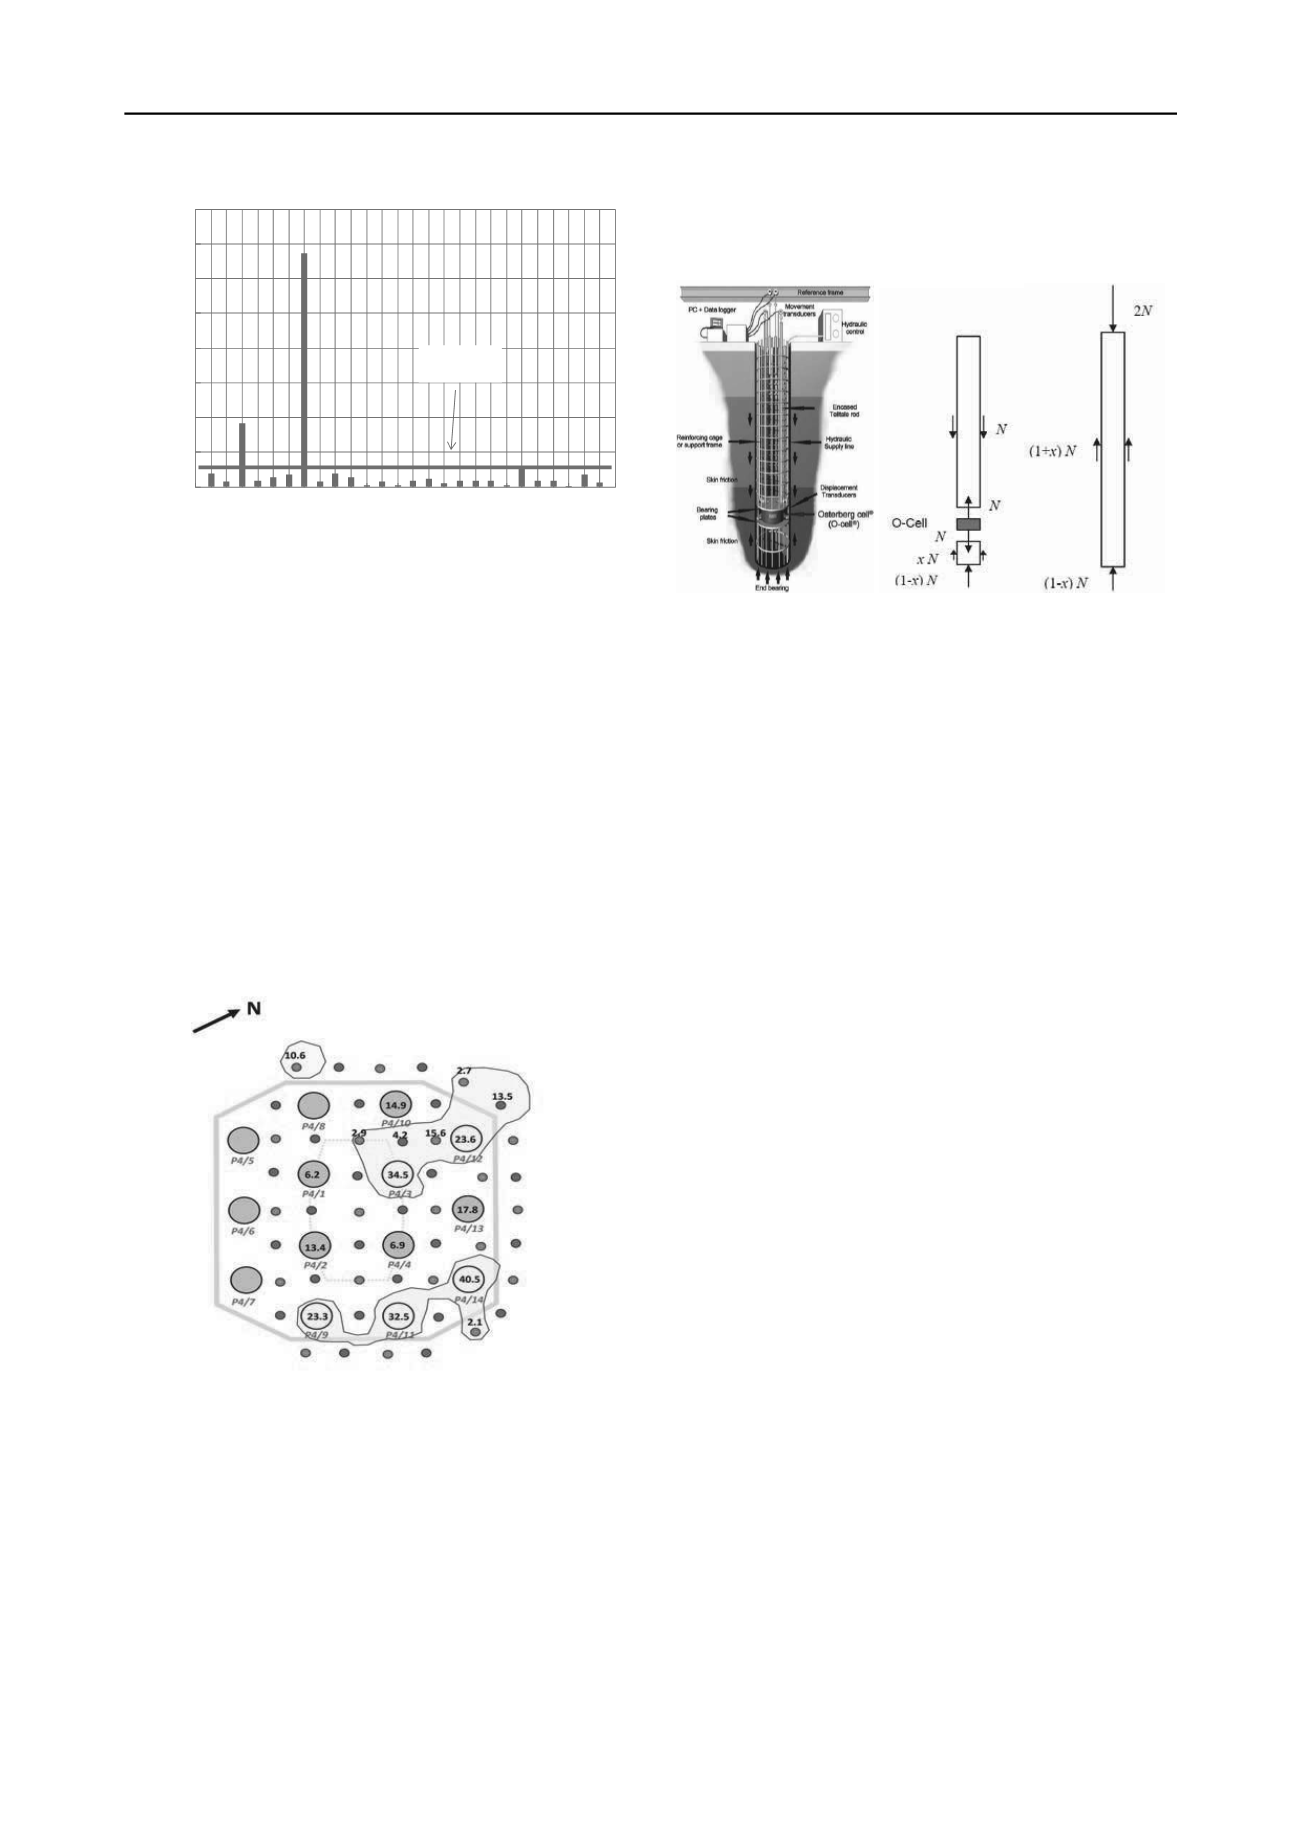
5 VERIFICATION BY PILE LOAD TESTING
To verify the capacity of the piles with pile toe in Marlstone the
most onerous pile in relation to the cavity, P4/3, was tested by
means of an O-cell load test carried out by Fugro LOADTEST.
The principle of the test is shown in Figure 10. In this case two
Ø870 mm O-cells were placed 1 m above the intended toe level
of the pile.
Figure 10. O-cell load test for a bored pile. (a) schematic set-up; (b)
load distribution in O-cell test; (c) load distribution in top down loading
The 1 m pile length below the O-cells safeguards against tilting
of the cells, due to uneven strength/stiffness distribution at the
toe of the pile. The pile length above the O-cell is 26.1 m.
Note that when loading top down (the design load situation)
it takes the double axial load to mobilise the same shaft and toe
bearing as with the O-cell test and hence a greater elastic pile
compression will occur.
For the test the pile was fitted with strain gauges, at six lev-
els in the Marlstone, and tell-tales at four levels including the
toe in order to be able to get a detailed understanding of the
stress distribution along the shaft. Unfortunately, these meas-
urements were inconsistent and deemed unreliable except for
tell-tales 1 (level +560.5), 2 (level +565.3) and 3 (level +571.0).
These measurements were combined with reliable values of the
upwards and downwards displacement of the O-cell and the bi-
directional O-cell load with a maximum load of 40.1 MN in
each direction.
The capacity of the O-cell was higher, but in order to safe-
guard against any detrimental effect from the testing on the
working pile the Owner decided to limit the load on the pile to
1.5 SLS.
The load test included three step-wise loading unloading cy-
cles:
(i) to a level corresponding to the maximum SLS load in the
pile group i.e. 26.5 MN
(ii) to 1.5 SLS ~ 40.1 MN (which exceeds the highest ultimate
state load for earth quake of ULS-EQ = 32.4 MN for Pile
P4/3) and
(iii) to SLS = 26.5 MN.
Creep was observed for up to 120 minutes for the designated
loading steps and during shorter periods (typically 10 minutes)
for the unloading steps.
The downward displacement of the bottom plate of the O-
cells as a function of the gross downward O-cell load is shown
in Figure 11.
A load of some 3 to 4 MN is required before displacements
are initiated. This corresponds reasonably well to the tension
capacity of the concrete section less the O-cell area (1.95 m
2
)
assuming
t
~ 0.06
c
= 0.06
35.5 = 2.1 MPa and thus a
breaking load of 1.95
2.1 = 4.1 MN.
This is slightly higher than the load required for breaking the
tack welds initially holding the O-cells closed (reported as 2.94
MN).
From Figure 11 it is apparent that the load-displacement
curve is almost linear until the maximum load of 40.1 MN ap-
plied.
The creep rate increases with load level with a maximum of
2.0 mm/log cycle of time for the maximum load.


