 
          2867
        
        
          Technical Committee 212 /


            Comité technique 212


            ‐30


            ‐25


            ‐20


            ‐15


            ‐10


            ‐5


            0


            0


            5


            10


            15


            20


            25


            30


            35


            40


            45


            Displacement[mm]


            GrossO‐cell load [MN]


            Initial O‐cell downward


            End of creep O‐cell down


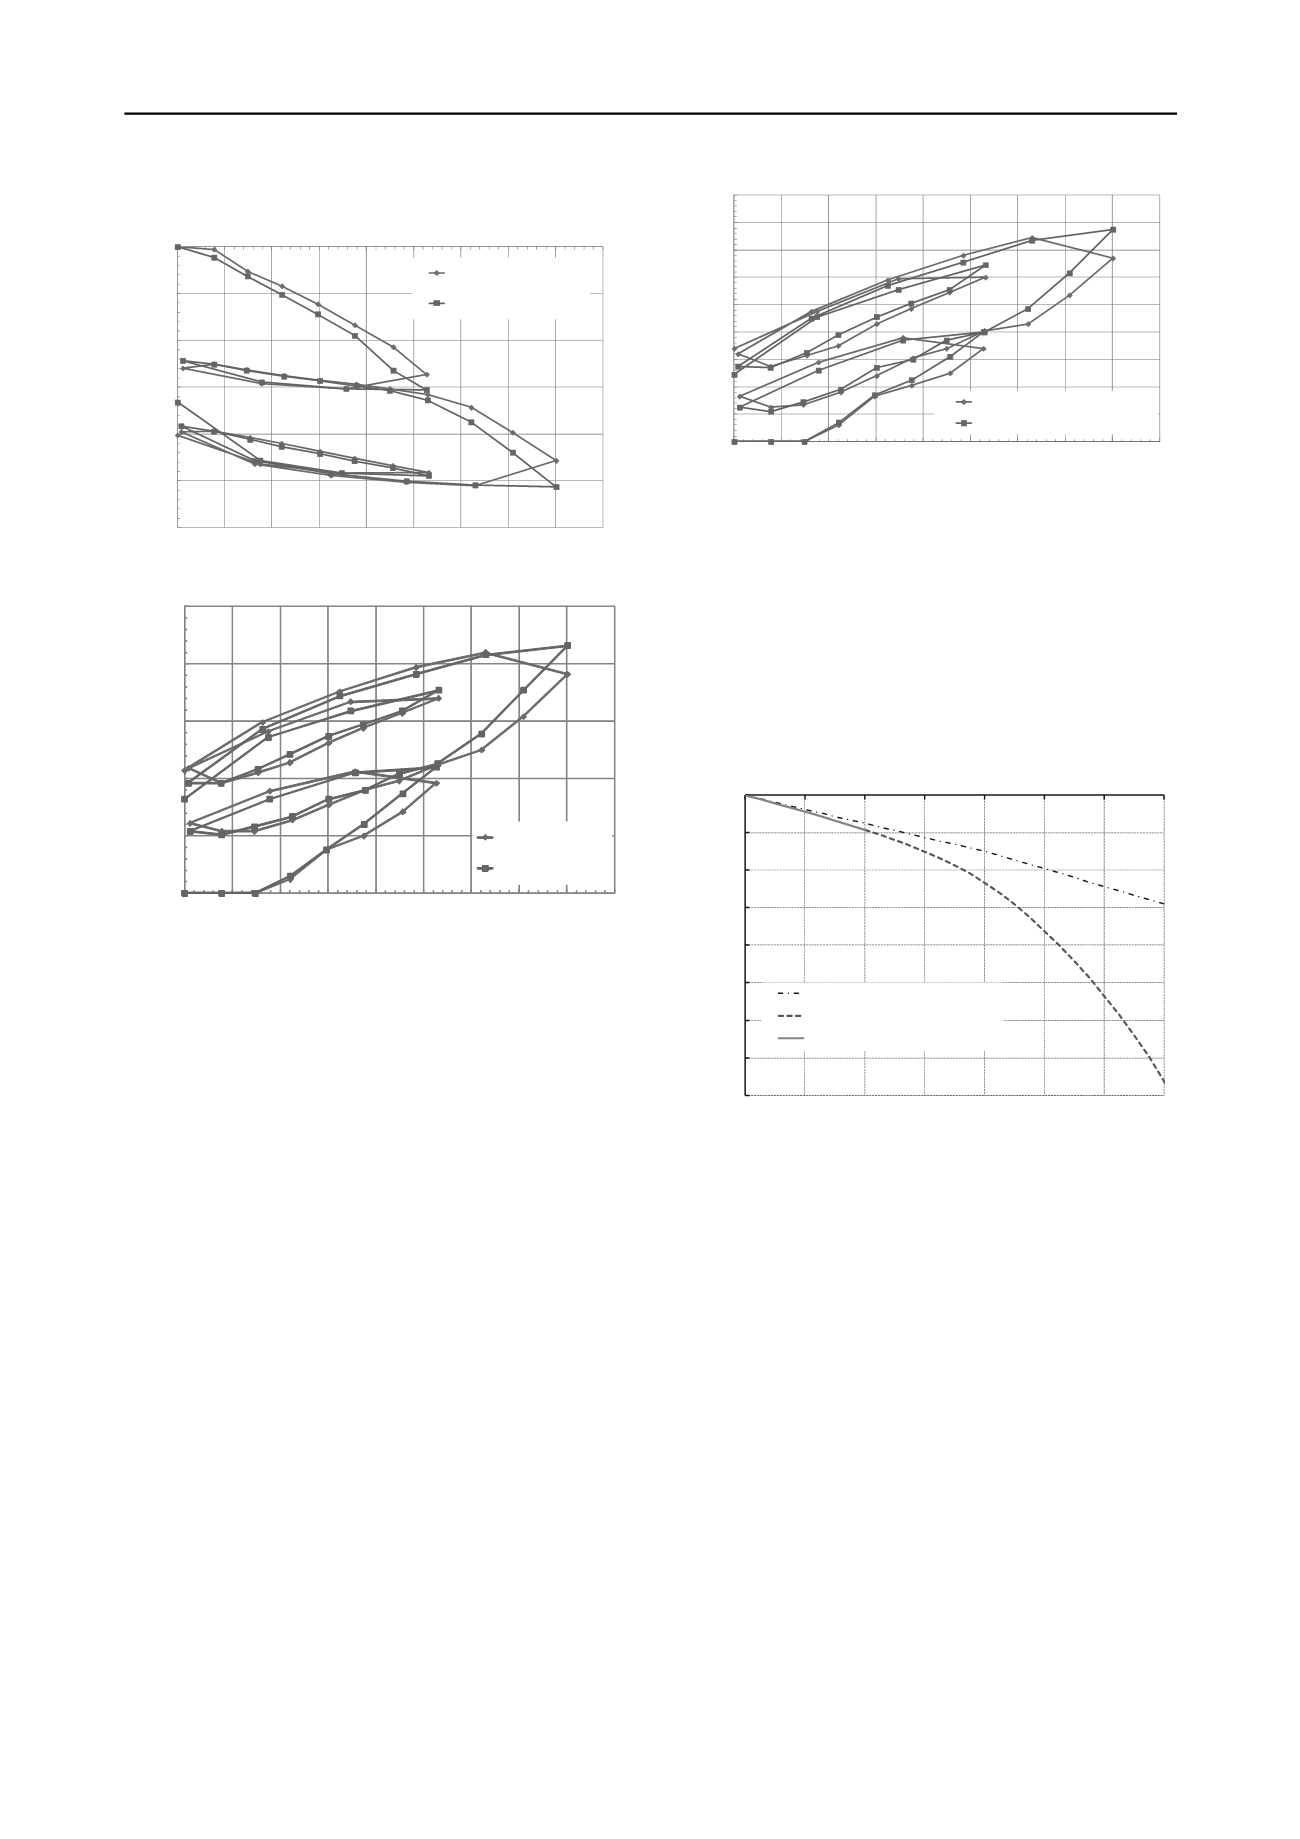
          Figure 11. Displacement of lower O-cell plate versus applied downward
        
        
          gross O-cell load


            0


            0.5


            1


            1.5


            2


            2.5


            0


            5


            10


            15


            20


            25


            30


            35


            40


            45


            D


            isplacem


            ent [m


            m


            ]


            GrossO‐cell load [MN]


            Initial O‐cell upward


            End of creepO‐cell up


          Figure 12. Displacement of upper O-cell plate versus applied upward
        
        
          gross O-cell load
        
        
          Considering, that the major part of the load below the O-cells is
        
        
          taken by toe bearing the creep rate is acceptably low. The corre-
        
        
          sponding creep rates for the top plate of the O-cells are an order
        
        
          of magnitude smaller and hence insignificant.
        
        
          The load-displacement curve for the upward O-cell dis-
        
        
          placement is shown in Figure 12. The upwards displacements
        
        
          are significantly less than the downward displacements (Figure
        
        
          11) and they are only initiated at an O-cell load of 7 MN after
        
        
          which the load-displacement curve is essentially linear. It is ap-
        
        
          parent that shaft stresses are locked into the system at unloading
        
        
          resulting in a non-recoverable displacement of approximately 1
        
        
          mm after unloading from the gross O-cell load of 40.1 MN (net
        
        
          load 38.8 MN after subtraction of pile weight).
        
        
          From the readings of tell tales 2 and 3 it is apparent that the
        
        
          displacements decrease very significantly with the distance
        
        
          from the O-cells and that initiation of displacements requires
        
        
          significantly greater O-cell loads than needed to initiate down-
        
        
          ward displacement.
        
        
          Tell tales 2 are at the transition from Marlstone to Marl 2 and
        
        
          hence the difference between tell tales 1 (top of O-cells) and 2
        
        
          indicate the "rock socket" shortening in the Marlstone as shown
        
        
          in Figure 13.
        
        
          This deformation corresponds to the accumulated displace-
        
        
          ment between pile and rock for developing the shaft resistance.
        
        
          As seen from the Figure the displacement is very small and al-
        
        
          most mirrors the upward displacement of the O-cell upper plate
        
        
          (Figure 11). It means that the displacement between pile and
        
        
          rock at the top of the Marlstone is only 0.6 mm and thus the pile
        
        
          capacity is very significantly higher.


            0


            0.2


            0.4


            0.6


            0.8


            1


            1.2


            1.4


            1.6


            1.8


            0


            5


            10


            15


            20


            25


            30


            35


            40


            45


            Displacement[mm]


            GrossO‐cell load [MN]


            Marlstone shortening initial


            Marlstone shortening end creep


          Figure 13. Shortening of the pile ("rock socket") in Marlstone between
        
        
          tell tales 1 and 2 versus applied O-cell gross load.
        
        
          The recorded working curves for the upper pile shaft and the
        
        
          lower pile segment may be fitted by "linear fractional" (hyper-
        
        
          bolic) functions, i.e.


            y = (ax + b)/(cx + d).


          This facilitates ex-
        
        
          trapolation of the working curves and production of synthesized
        
        
          top load settlements curves.
        
        
          The methodology by Fleming (1992) was used to produce
        
        
          the predicted top load settlement curve shown in Figure 14.


            0


            10


            20


            30


            40


            50


            60


            70


            80


            0


            20


            40


            60


            80


            100


            120


            140


            Predicted pile top settlement [mm]


            Pile head load [MN]


            Elastic shortening


            Total settlement


            Predictedfrommeasuredvalues


          Figure 14. Predicted top load settlement curve for Pile P4/3
        
        
          It is apparent from Figure 14 that a top loading of 26.5 MN
        
        
          (corresponding to the maximum SLS load in the P4 Pylon pile
        
        
          group) will cause a pile head settlement in the order of 6 mm.
        
        
          Twice the load, 53 MN (twice the SLS load and larger than the
        
        
          maximum ULS load of 45.5 MN in the pile group) will result in
        
        
          only 13 mm settlement.
        
        
          Thus, even for the ultimate limit state (ULS-EQ) loading of
        
        
          the actual pile of 29.6 MN the predicted settlements are only
        
        
          slightly larger than the elastic part of the working curve.
        
        
          6 EVALUATION OF ROCK SOCKET CAPACITY
        
        
          The maximum toe and shaft design loads for pile P4/3 are 4.5 to
        
        
          4.9 MN and 21.0 to 26.5 MN, respectively. The range reflects
        
        
          upper and lower bound soil stratification and soil spring as-
        
        
          sumptions. As seen from Figure 11 and Figure 12 the load test
        
        
          indicates much higher values even within near elastic load-
        
        
          displacement behaviour.
        
        
          For the toe bearing of the rock socket the mobilisation of the
        
        
          resistance may be assumed to vary roughly proportional to the
        
        
          square root of the mobilised displacement, where


            ult,t


          (toe bear-
        
        
          ing) ~ 0.1


            D


          = 200 mm: