2865
Technical Committee 212 /
Comité technique 212
group and to safeguard against excessive or differential overall
displacements.
The grouting scheme devised consisted of primary and sec-
ondary grouting holes in staggered sequence as shown sche-
matically in Figure 5. To maximize the effect the sequence of
grouting is staggered.
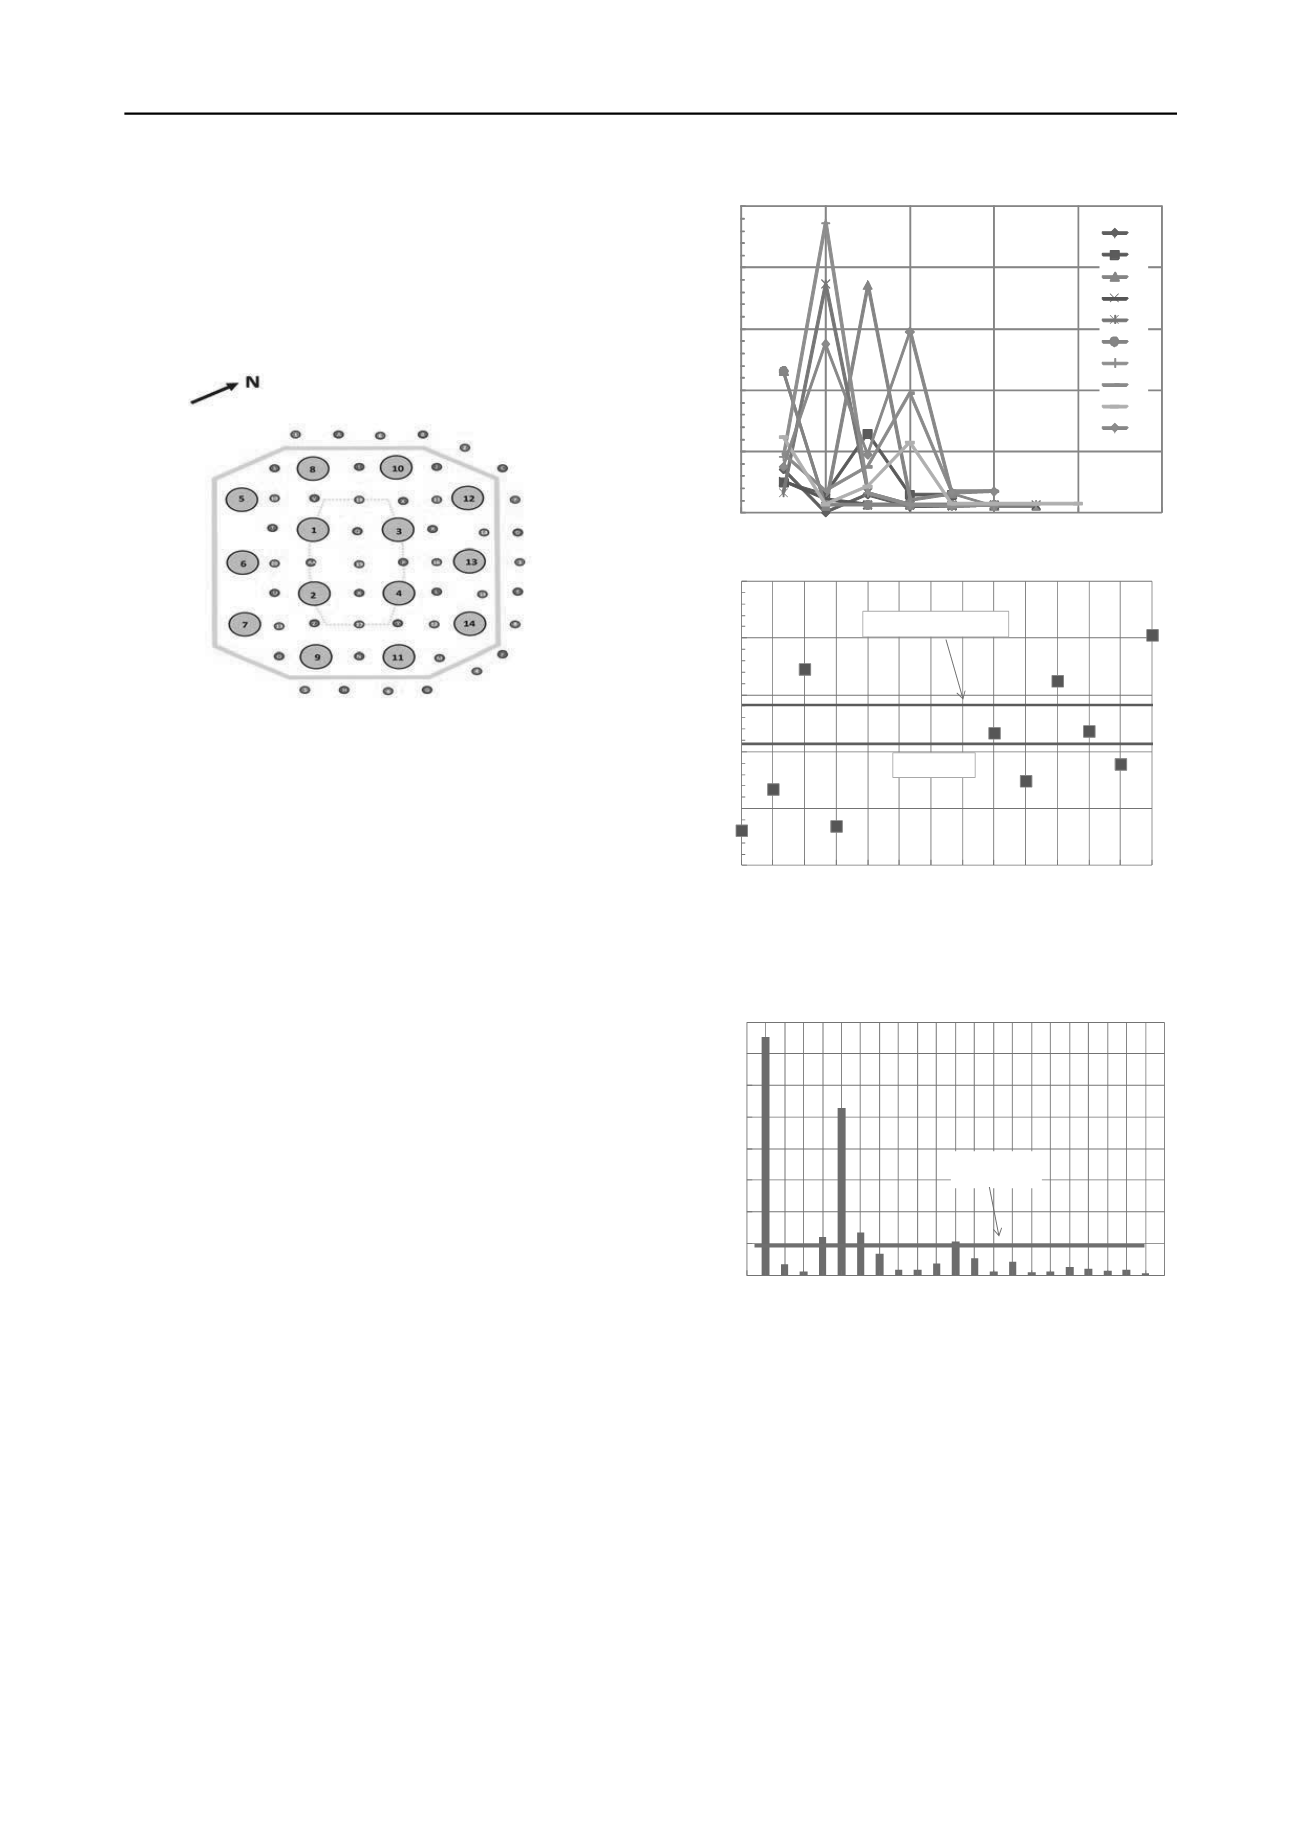
Figure 5. Schematic grouting scheme with primary grout holes in Ara-
bic numbers and secondary grout holes in letters (pile numbers of the 14
Ø2 m piles shown for reference; piles 5, 6, 7 and 8 were drilled into the
competent limestone prior to the remediation scheme).
The holes for pressure grouting (40 m deep) were drilled "de-
structively" from the ground surface using a Ø141 mm drill in
the Marl (with casing) and a Ø105 to 115 mm drill to the full
depth (without casing). The grout take was carefully measured
using the same type of grout as before, but now with a settling
<5% after 2 hours. The uncased part passing through the cavity
feature was pressure grouted using packers with 12 bar pressure.
The cased part was gravity grouted as the casing was with-
drawn.
4 MONITORING OF REMEDIATION MEASURES
Based on the surface texture of the holes drilled for the piles
(very uneven surface) the actual consumption would be ex-
pected to be higher than the theoretical consumption based on
the bore and grout hole diameters. The consumption of concrete
when casting the Ø2000 mm piles was:
Piles P4/5 to P4/8 (46 to 50 m length): 113% ± 3.7%
Remaining 10 piles (22 to 28 m length): 108% ± 1.8%
i.e. roughly 10% excess consumption.
As the Ø178 mm holes were re-drilled it seems likely that
actual nominal consumption would be 115% of the theoretical
consumption. Using this as baseline the excess grout take from
the five reinforcement-holes below each of the ten Ø2000 mm
piles are shown in Figure 6. In some cases re-grouting of the
holes took place and hence a sequence number in excess of five
occurs for some of the piles.
Although there is considerable scatter the excess grout take
decreases by and large as a function of the sequence as would
be expected as any cavity feature will be more readily filled
during the initial grouting. Piles 3, 9, 11, 12 and 14 show grout
take above average which is interpreted as a more persistent
cavity feature at these locations.
0
5
10
15
20
25
0
2
4
6
8
Excess grout take per m
icropile (m
3
)
Sequence of micropile grouting per pile
10
1
2
3
4
9
10
11
12
13
14
0
10
20
30
40
50
1 2 3 4 5 6 7 8 9 10 11 12 13 14
Excess grout take in micropiles (m
3
)
Pile Number
average
95% upper limit
Figure 6. Excess grout take in "micropile" holes; (a) as function of se-
quence (2-6 weeks from grouting of fist to last pile); (b) accumulated
values per pile location
0
2
4
6
8
10
12
14
16
P11
P16
P19
P18
P1
P2
P6
P7
P8
P9
P4
P5
P3
P12
P13
P17
P10
P20
P9 bis
P15
P14
Excess grout take (m
3
)
Primary grout hole
average
Figure 7. Excess grout take versus sequence for primary grout holes
The actual sequence of the subsequent pressure grouting in pri-
mary (Figure 7) and secondary (Figure 8) deviated slightly from
the sequence in Figure 5 but followed the principal intent. The
theoretical grout take was based on the nominal drilling diame-
ters but with reference to the considerations for the piles and
pre-drilling holes this may entail some 15% underestimation of
take.
As seen in Figure 7 and Figure 8 the excess grout take was
very limited in the majority of holes.


