2870
Proceedings of the 18
th
International Conference on Soil Mechanics and Geotechnical Engineering, Paris 2013
analysis and geotechnical modeling software of varying levels
of sophistication, especially when it comes to the treatment of
piles and pile groups.
2.1
Pile and Pile Cap Arrangements
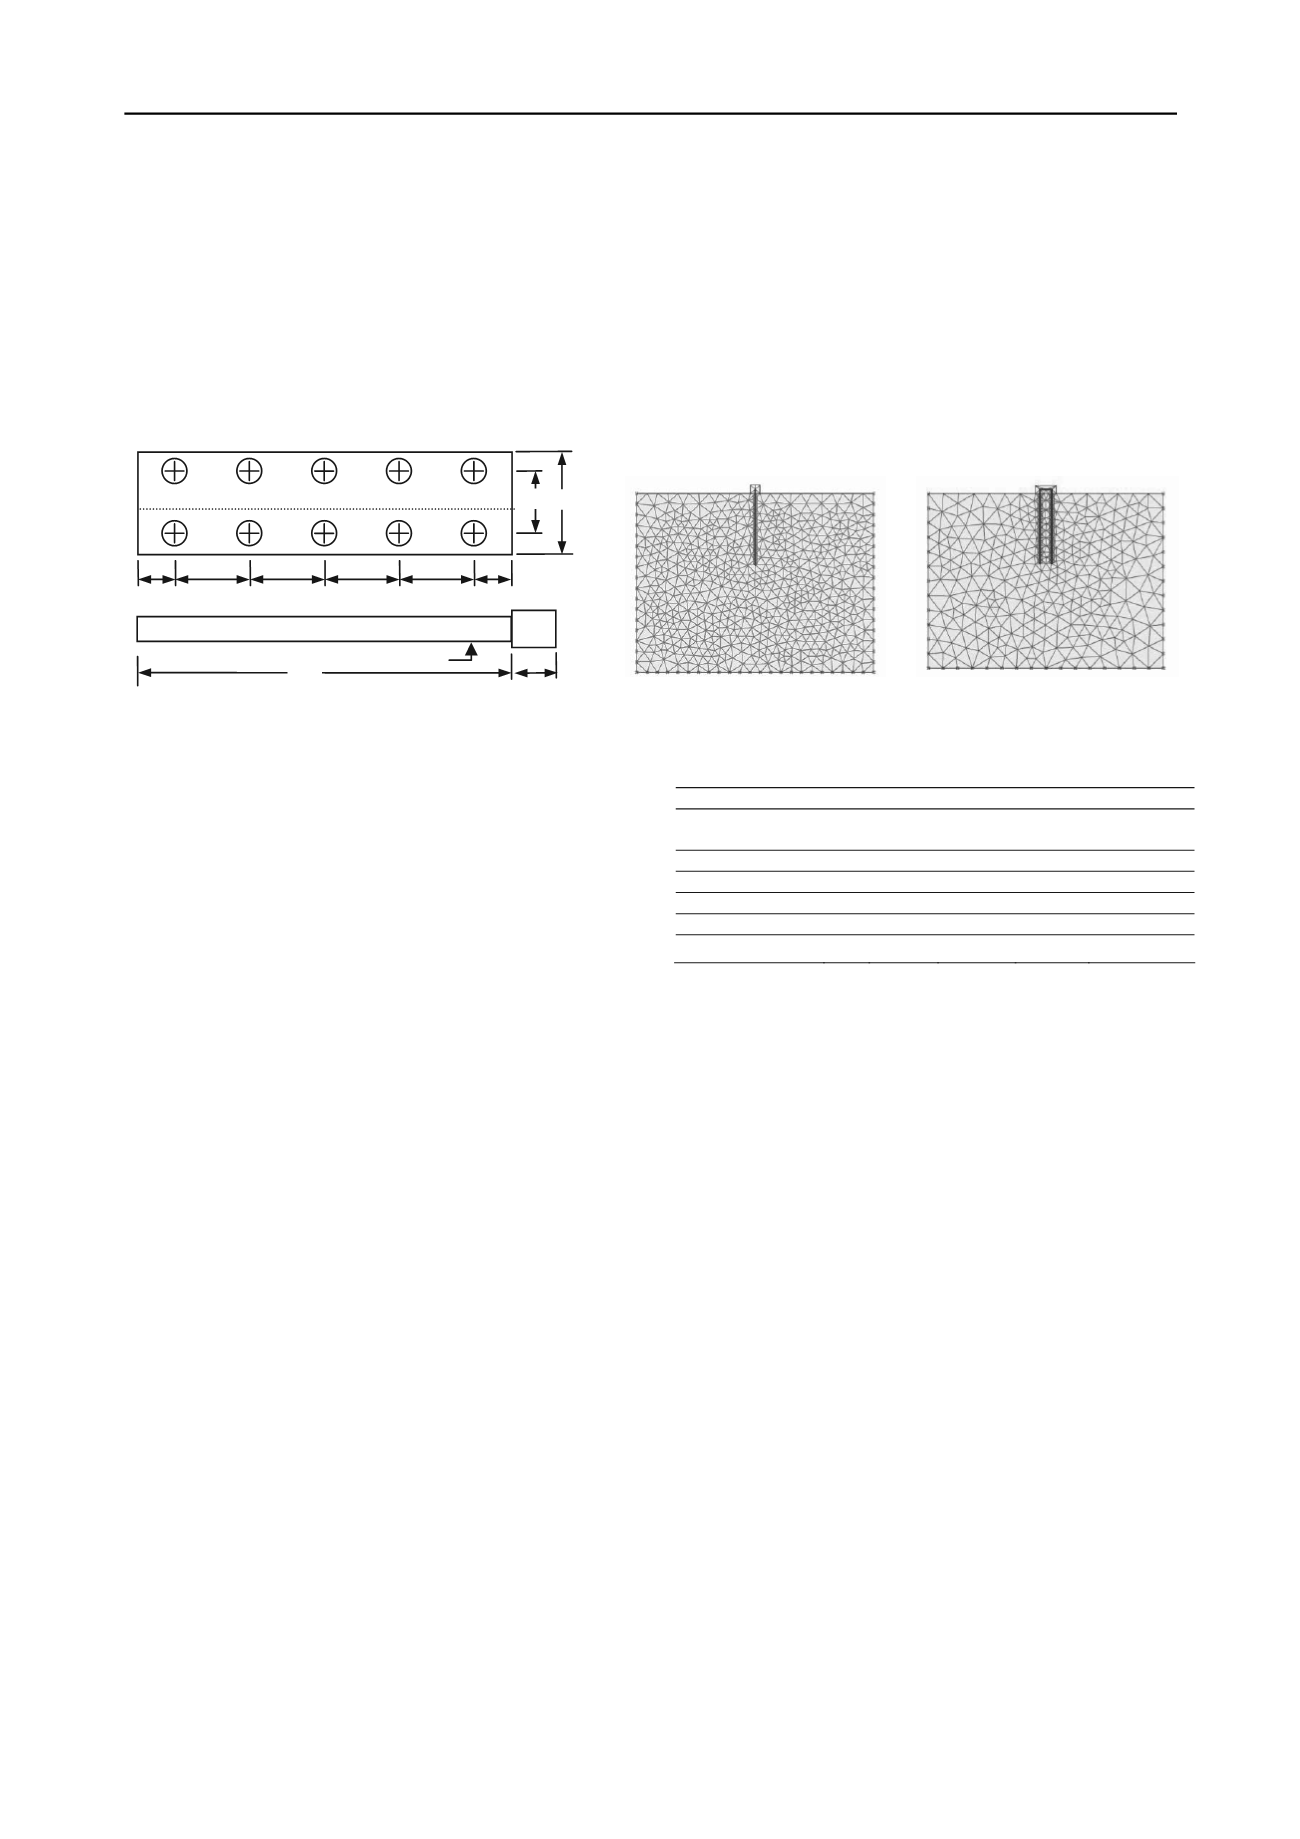
Figure 1 shows the basic pile configurations studied here. A
series of progressively more complex pile foundations were
examined: one, two, three, and five piles in a single row, then
two, four, six and ten piles in a double row. Pile lengths and
center-to-center spacing were identical.
Single-line piles have become a favorite design alternative
for bridge foundations in Hungary. Based on construction
methods and materials, it is usually the most economic
alternative. Pile type is the Continuous Flight Auger (CFA).
There is some debate about how to model the pile structurally
since its diameter is variable and difficult to estimate. The
choice of diameter=0.8m seems to work best when compared to
past pile load test data and examination of excavated prototypes.
With the new, advanced geotechnical packages more
realistic modeling of soil-structure interaction becomes
possible. For some critical problems, calculations show more
favorable mechanical behavior than it was assumed based on
routine bridge design calculations. Calculations show that the
piles in the abutment have significantly lower loads on them
than suggested by the Winkler-style models (Reese and Wang
1997) while the piles of the intermediate supports suffer more
significant horizontal displacements and are subject to greater
loads than previously assumed (Szép 2011).
2.2
Analysis Methods
As a first step, a single laterally loaded pile (
Fig. 1
) was
analyzed using three different numerical methods. Results of
bending moment distribution and displacements were then
compared. The three numerical methods are:
AXIS 10VM, the fundamental structural design tool in
Hungary;
GEO4 (and GEO5), an increasingly popular
geotechnical design code;
PLAXIS and MIDAS GTS, 2D and 3D geotechnical
FEM packages that provide more realistic modeling for
soil-structure interaction.
The AXIS and GEO software use similar subgrade reaction
approaches to determine lateral pile behavior. The GEO
software allows the user to calculate subgrade reactions as they
are distributed down the pile and can allow for different backfill
levels on either side as well as adjusting for passive and active
conditions. AXIS uses a more direct approach in placing the
subgrade reaction springs along the pile at discreet points. Both
software packages will model the soil response as elastic or
elasto-plastic with a specified strength limit.
3 2-D ANALYSIS AND RESULTS
The first level of analysis was a 2-D simplification of the actual
geometry. This is a common design and analysis simplification
that allows the engineer to evaluate the effects of 1-row or 2-
row pile group as well as estimating the deflections, rotations,
and bending moments generated within the model. Due to the
relative ease of analysis, many design alternatives can be
considered on a trial basis, and decisions made to further refine
the design alternative or discard it. The two candidates for
analysis are shown above (Figure 2) with element meshes
generated by Plaxis. Material properties used in the analyses are
presented in Table 1. Pile dimensions are identical to those
presented in Figure 1. Interface elements were also used to
better represent soil/pile interaction. Results from the analysis
are summarized in Figure 3. Lines most closely paired in the
figure are one- and two-pile geometries indicating that doubling
the number of piles has less effect than doubling, or halving the
applied load. While the group-effect for this configuration has
been studied before (Bak et al, 2010), the structural design
implications can be more difficult to assess. The altered
flexibility of the substructure now comes into play when
dimensioning structural elements for the superstructure.
From Figure 3 one may also see that the rotation of the pile
head for single-row groups is far greater, leading to greater
deflections above the foundation. Most noticeable is the degree
of rotation for sand where the soil is relatively much weaker
near the surface than at depth, causing a very pronounced
curvature in the pile. Comparing the Plaxis results with AXIS
and GEO4 is a challenge. One may choose a wide variety of
subgrade reaction values for AXIS and GEO4 and produce a
corresponding wide variety of answers. In this study, a great
deal of effort was spent trying to follow recommendations of the
software providers and base subgrade reaction values on
formulae and soil properties consistent with the other analyses.
Figure 2. Two dimensional model for 1-row and 2-row pile groups.
Sand
Clay
Concrete
Young’s
Modulus
E
kN/m
2
20 000
5 000
20 000 000
Poisson’s-Ratio
ν
–
0.3
0.3
0.15
Dry unit weight
γ
d
kN/m
3
20.0
20.0
24.0
Wet unit weight
γ
t
kN/m
3
20.0
20.0
–
Cohesion
c
kN/m
2
0
20
–
Angle of Friction
ϕ
°
30
20
–
Table 1. Material properties for analysis
2.0
1.2
ϕ
=0.8
2.4
12.0
2.8
2.4
2.4
2.4
1.2
1.4
Figure 1. Model dimensions for pile study.


