1870
Proceedings of the 18t
h
International Conference on Soil Mechanics and Geotechnical Engineering, Paris 2013
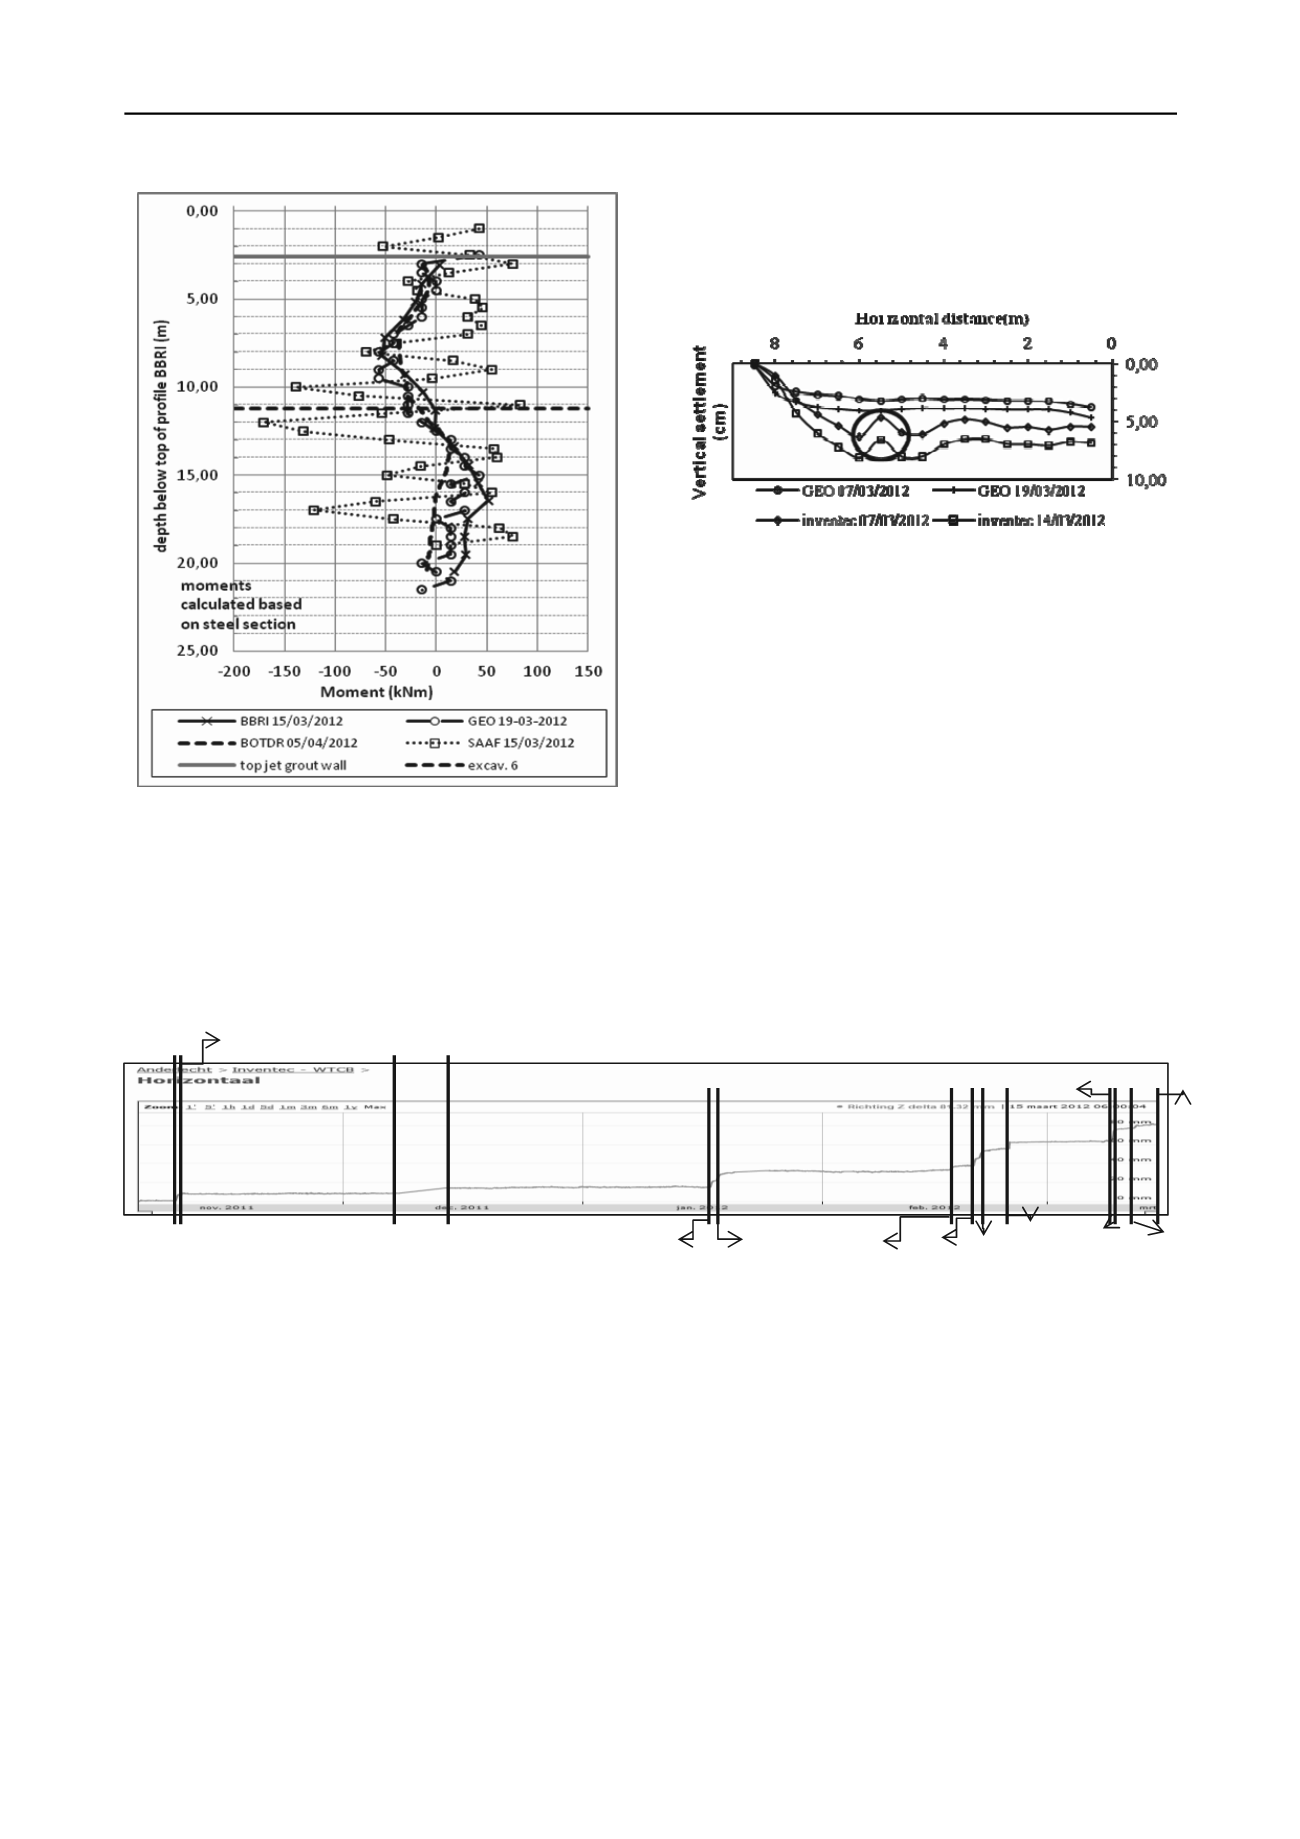
The “bump” in the measurements of the SAAF (circled in
Figure 8) is caused by the lifting of the tracks on 25/02/2012, as
explained above. This “bump” has no influence on the
settlement which is measured at the end of the railway tracks.
Figure 8. Settlements measured with hor. SAAF and hor. inclinometer.
The measurements made with the electrical beam sensors
give comparable results to the measurement of the SAAF. The
data measured with the optical strands appears to be
uninterpretable. This is probably because it was in no way
connected to a fixed point.
3 CONCLUSIONS
Figure 6. Bending moment HEB profile after the last excavation.
2.3
Settlements behind the jet grout wall
The calculated settlement prior to installation is 5mm. The
measurements indicate a maximum settlement varying between
50 mm and 70mm for the different measuring techniques, which
is much larger than the calculated value. Figure 7 shows the
evolution in time of the maximum settlement value as measured
by the SAAF. It demonstrates the great advantage of measuring
continuously.
An extensive monitoring program was set up to compare
different monitoring techniques. It appears that both new and
traditional techniques can lead to the same result, when
sufficient care is taken to the installation and interpretation. A
significant advantage can be seen when continuous monitoring
is applied, as the link with execution phases can be made.
4 ACKNOWLEDGEMENTS
The IWT is gratefully acknowledged for their support.
Figure 7. Maximum settlement as a function of time for the horizontal
SAAF.
When comparing Table 1 with Figure 7, it can be seen that
the discontinuities in the settlement curve correspond each time
with the installation of the nails. In Verstraelen et al. 2013, it is
explained that this is due to the execution of the jet grout nails.
The settlement on 25/02/2012 is caused by lifting the tracks,
due to which the inclinometer was locally displaced.
Figure 8 shows the settlement measured by the horizontal
inclinometer and the SAAF on two different dates. The zero
settlement point corresponds with the fixed point on the
Berliner wall. A significant difference between the settlements
measured with the two techniques can be observed (approx.
30%). When comparing with the topographical levelling, it can
be concluded that the measurements made with the horizontal
SAAF are closest to the real settlements. This can be explained
by the limited length of the inclinometer tubes (8m) and the fact
that the stiffness of a traditional inclinometer tube is quite high
for such a short distance (and large settlements).
14/12/11
13 45
09/11/11
20u
15/03/
09/03/12
5 REFERENCES
Van Alboom G., De Vos L., Haelterman K., Maekelberg W. 2012.
Innovative monitoring tools for on line monitoring of building
excavations. A monitoring test site.
ISSMGE- TC 211 International
Symposium on Ground Improvement,
Brussels, IV-327 – IV-338.
Verstraelen J., Maekelberg W., De Vos L. 2013. Design and
performance of a jet grout retaining wall in a railway embankment on
soft soil. Proceedings of the 18
th
International Conference on Soil
Mechanics and Geotechnical Engineering, Paris
08/12/11
7u
17/01/12
11u
18/01/12
17u
17
/
20/02
12u 21/
02
25/02
3u
09/0
3 17u
12/03
7u
12
09/1
1/11


