1869
Technical Committee 206 /
Comité technique 206
11/01/2012
Excavation up to 5m below the top of the
concrete beam
17-20/01/2012
Installation of third row of nails
01-02/02/2012
Excavation up to 7m below the top of the
concrete beam
14/02/2012
Putting in gravel for ground improvement
17-21/02/2012
Installation of fourth row of nails
27/02/2012
Installation load cells GEO
08-09/03/2012
Unspecified drilling activity
12-13/03/2012
Excavation up to 8,5m below the top of the
concrete beam
13-14/03/2012
Installation of 5
th
row of nails
2 MEASUREMENTS
The measurements made by the 3 tenderers are continuous and
data is transferred over the internet. The verification
measurements, both with traditional equipment and innovative
techniques are performed at discrete moments in time.
2.1
Deformation of the jet grout wall
The instrumentation is placed on the HEB profiles which are
lowered in the jet grout wall. The traditional inclinometer and
the SAAF measure the inclination of the profile every 0.5m,
allowing direct derivation of horizontal deformation of the wall.
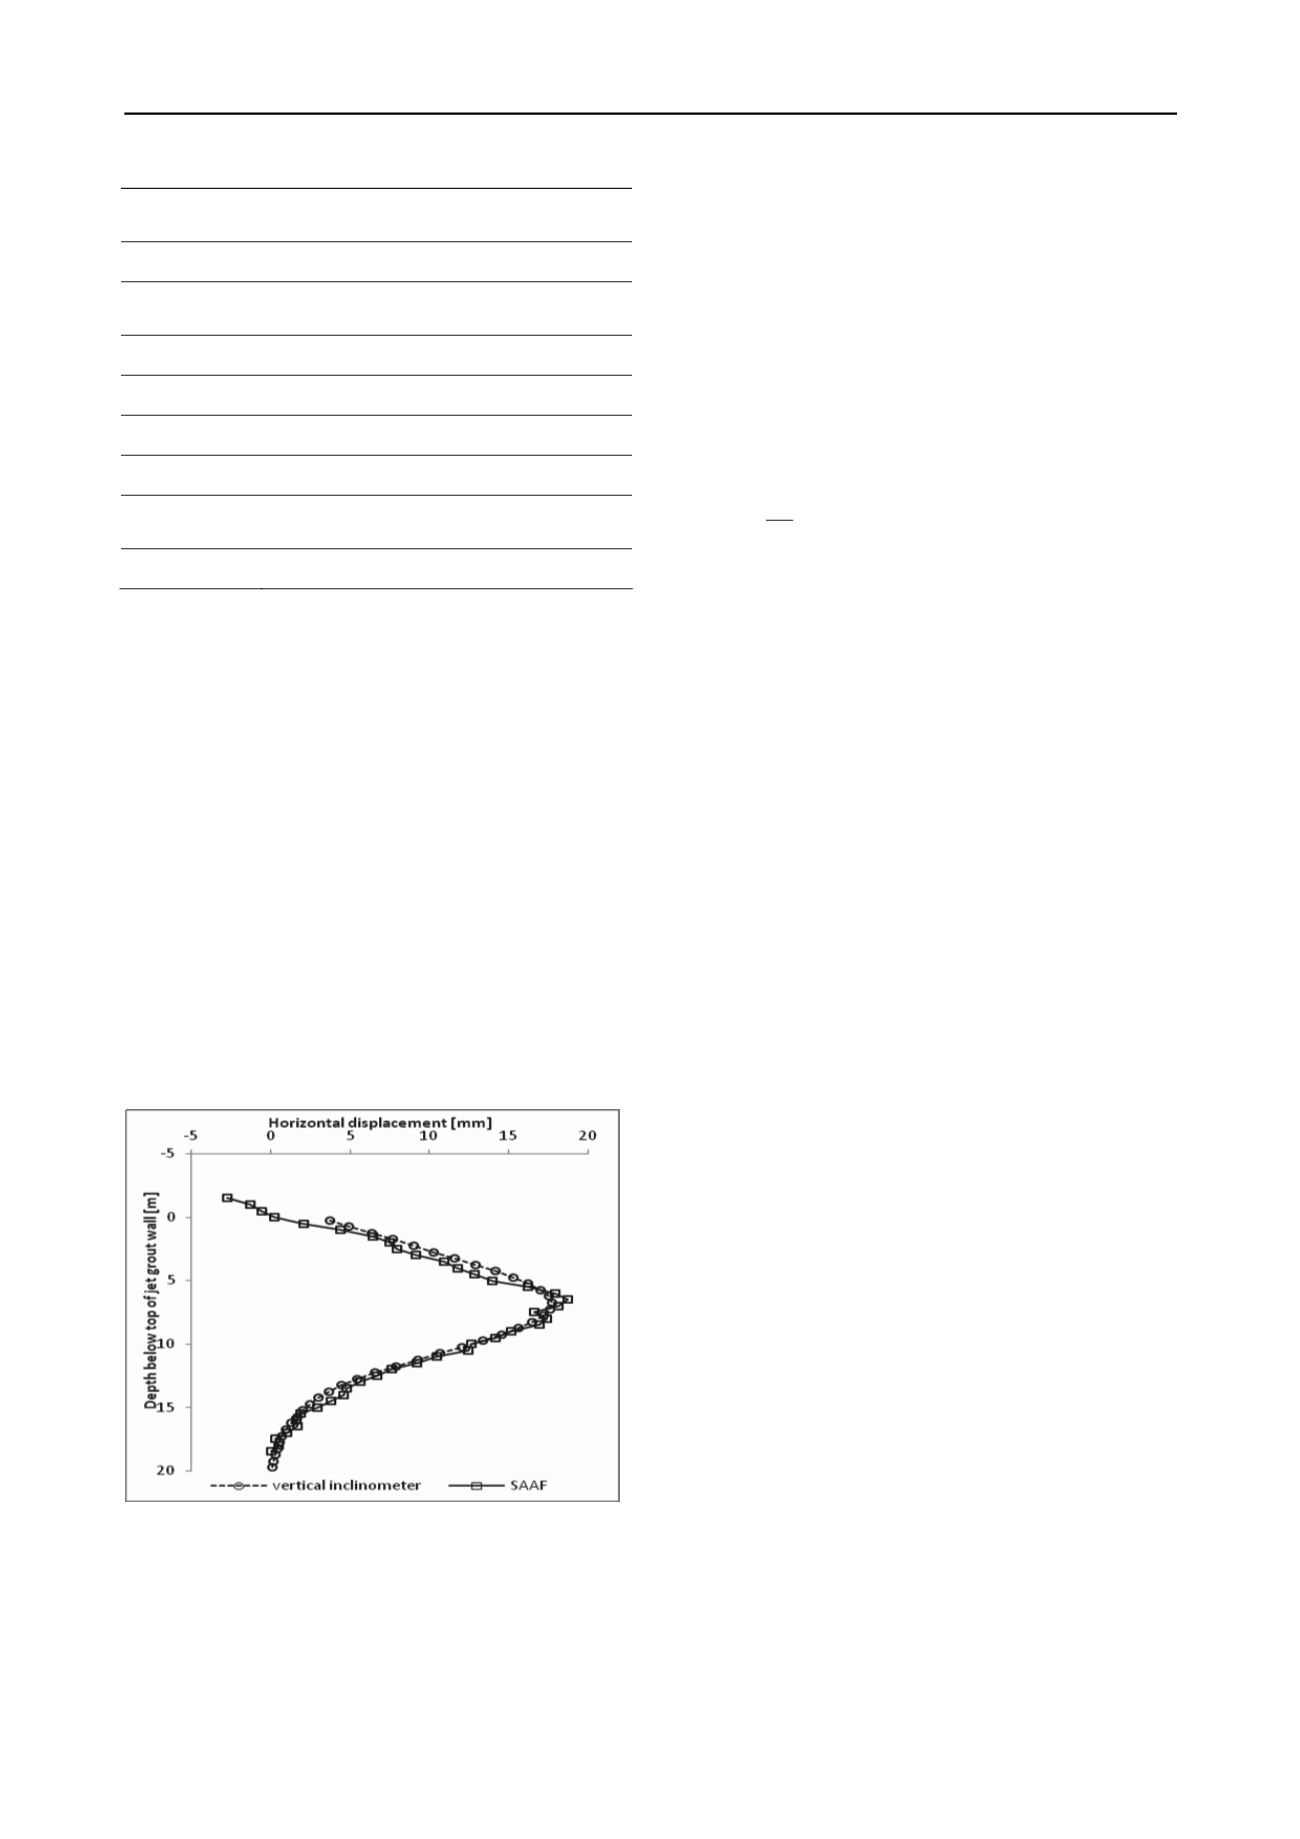
Figure 5 shows the horizontal deformation of the HEB
profiles, measured with the traditional inclinometer and the
SAAF. These measurements are both made on the same date
and are taken after the installation of the fourth row of nails.
The excavation depth at that time is 7m. The data fit very well
together. The data from the SAAF start above the reference zero
level (which is the top of the grout wall), as the HEB profile did
not reach full depth and protruded about 1.7m above the top of
the grout wall.
Figure 5. Horizontal deformation of the HEB profile on 07-03-2012.
The maximum horizontal displacement, measured after full
excavation, amounts to 21 mm (26/04/2012) at a depth of 6.5m
below the top of the grout wall for the inclinometer and 21.6mm
for the SAAF. This lies very close to the calculated value of
22mm. It is found however that the direction at which the
maximum deformation is found for the SAAF deviates slightly
from the expected angle (perpendicular to the wall). This is
probably due to a very small twist in between the different
elements of the SAAF.
The other optical fiber instrumentation measures the strains
in the HEB profiles and derivation of deformations can only be
achieved by integration of the measured strains. This implies
knowledge of the boundary conditions. Furthermore, the
stiffness of the combination jet grout wall and HEB-profile
needs to be estimated to obtain the deformation. It was found
that there are a lot of assumptions which need to be made to
obtain a reliable result. Further analysis will be attempted in the
future.
2.2
Moments in the jet grout wall
From the inclinometers, the bending moment can be derived as:
dx
dEI M
(1)
with E Young’s modulus, I the moment of inertia of the HEB
profile and
the inclination.
From the fiber optics, which measure strains at regular
intervals, the bending moment can be obtained as:
EW M
(2)
with
measured strain and W the section modulus. All fiber
optics are mounted on the top and bottom flange of the HEB
profile. Strains resulting from temperature differences or normal
forces can thus be excluded and only the bending strain is
withheld.
For the optical strand, measuring only 1 strain over its full
length (top 10m of the HEB profile), the moment can also be
derived with Eq.2, only this will result in 1 single bending
moment and not in a bending moment as a function of depth.
Figure 6 shows the bending moments derived according to
Eq. 1 and Eq. 2 for the different measuring techniques (except
for the optical strand, as this does not result in a bending
moment as a function of depth). Unfortunately, a lot of the FBG
sensors placed by FBGS failed during the first weeks after
installation. For this reason, they are not included in the graph.
For the stiffness of the wall, the stiffness of the HEB profiles
was used, as the instrumentation is placed on these profiles.
The discontinuous and continuous measurements were not
always measured on the exact same dates. However, all
measurements are made after the final excavation phase.
Figure 6 shows that all derived bending moments give
comparable values, except for the SAAF. This can be explained
by the fact that the deformation measurements of the SAAF are
less “smooth”. As the bending moment is a result of the
derivative of the measured inclination, this results in unexpected
peak values.
A maximum bending moment of about 55 kNm is derived
from the measurements. This is again in the same order of
magnitude as the calculations (maximum calculated bending
moment of 65 kNm). For the optical strand, the derived bending
moment is about 35kNm, which is considerably lower than the
other measurements. Due to the smoothing which is used for the
BOTDR measurements, the peak bending moment is also
reduced and has a value of 39kNm, which is also less than the
value obtained by the inclinometer and the FBG technique from
the BBRI. The shape of the bending moment curve however, is
comparable to the other results.


