1865
Technical Committee 206 /
Comité technique 206
inspecting and assessing concrete quality. Fibre optic cables
were attached to a flexible pipe and installed to the full depth of
the cored hole. Table 1 lists the detailed level of the under ream
pile. In addition, a new borehole was drilled to 35.5m adjacent
to an instrumented pile in the basement and also instrumented to
full depth to capture potential ground heave during the
demolition process.
This paper will present the data recorded during the
demolition process and summarise the results to highlighting
the role of the instrumentation in the successful reuse of the
deep foundations on this project. It will also include details of
challenges faced in using the fibre optic sensors to instrument
existing deep foundations, which is believed to be the first of
such use in the UK.
Table 1. Summary of instrumented pile
PileE47
Core length [m]
20.16
Coring length [mAOD]
7.46
Toe Level [mAOD]
-13.70
Original Design Toe Level
-13.00
Shaft Diameter [mm]
1500
Bell Diameter [mm]
3300
3 FIELD DATA ANALYSIS
There are ten sets of strain data that have been collected on five
dates from 15/08/2011 to 05/10/2011 up to building level 3 of
the demolition programme. All optical fibre strain sensing
cables and optical fibre temperature sensing cables, installed in
the pile and the borehole close to one of the piles, were
monitored as close as possible to the removal of each floor. The
data from 15/08/2011 taken when the 6th floor had been
demolished and 05/10/2011 when the 3rd floor was demolished
is presented in this paper to evaluate the pile and borehole
performance. The original geotechnical design load on the pile
was around 7,250 kN to 7,500 kN, but the structure takedown
load on these piles (i.e. the load they experienced under use) is
more likely to be around 65 percent of this at around 4,700 kN
to 4,900 kN.
3.1 Pile E47
The first set of data was taken on 15/08/2012 and has been
considered as the reference for comparing with the dataset
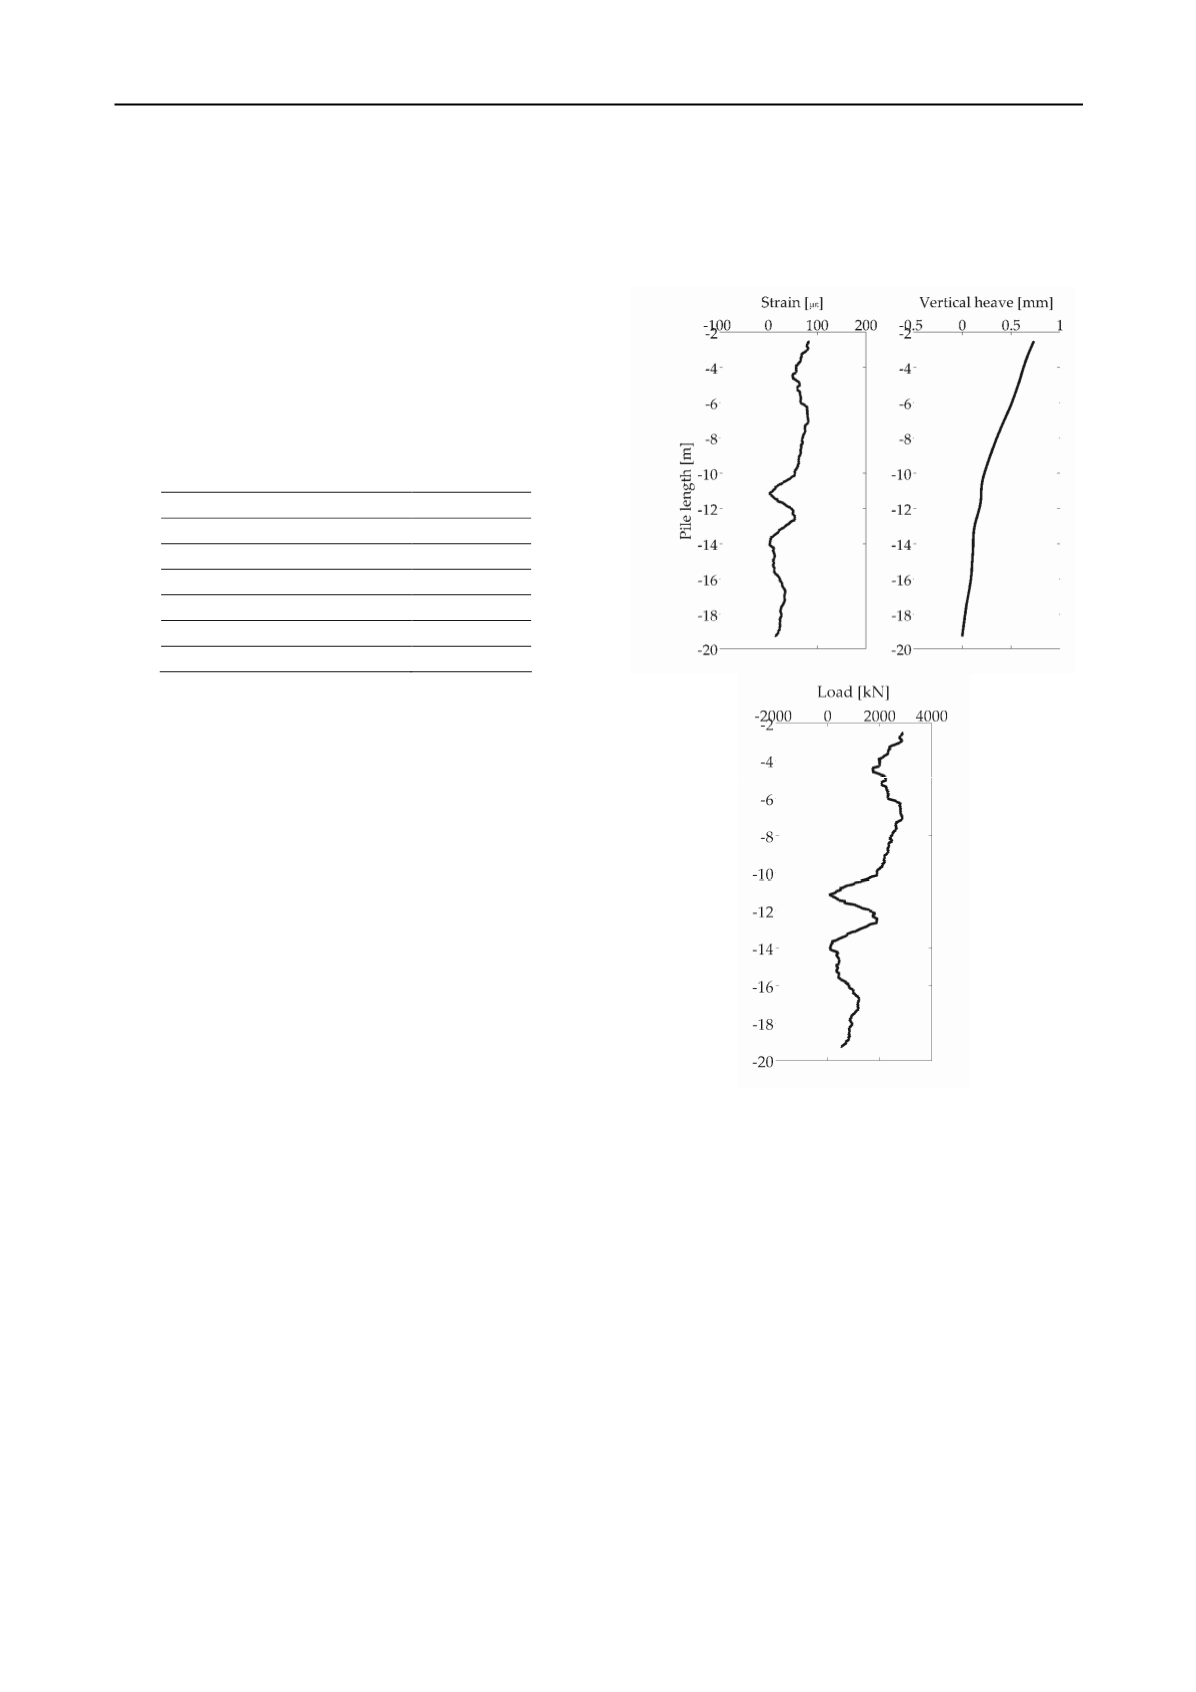
collected on 05/10/2012. The profile of strain change between
the two periods is shown in Figure 5(a). In general, the axial
strain is reducing from the top to the middle part of the pile (0-
9m) in the range between 0 and 100 micro-strain, and the axial
strain change becomes reasonably small in the base part of the
pile (9-17m). After integration of the strain profile, the
calculated overall vertical heave between the two periods is less
than 1mm at the pile head as shown in Figure (b).
Pile E47 was initially constructed with a design concrete
strength
f
cu
of 30
N/mm
2
, with a corresponding modulus of
elasticity varying from 20 to 32
GPa
as suggested by BS 8110-
2:1985. The concrete strength data taken from the tests on the
full length cores in pile indicates that the concrete strength in-
situ is between 47
N/mm
2
to 56
N/mm
2
. The modulus of
elasticity of this concrete can be calculated, allowing for creep
and degradation, as ranging from 26 GPa to 43GPa. Figure 5(c)
shows the load profile by assuming the p
ile Young’s modulus is
26GPa. Hence, the axial force reduction at the top of pile can be
estimated to be around 3,830 kN, which roughly corresponds
well to the load removed between the two periods.
It is believed that nominal starter cages were installed into all
of the original under-ream piles on this site and are likely to be
between 9m and 12m in lengths. Reinforcement details for the
existing piles were not available, as is often the case with reuse
projects. The cage toes were observed in the strain
measurements at 10m to 13m as a change in the strain profile,
which indicates the pile is experiencing tension forces around
the base of the reinforced section. It is suspected that this is as a
result of the different Young’s modulus between the reinforced
and unreinforced sections of the pile.
Figure 5. The calculated pile performance due to the demolition
activities: a) axial strain along the pile; b) vertical heave; c) pile load.
3.2 Borehole
In comparison to the pile reaction to the demolition of the
substructure, the magnitude of change in strain along the
borehole is less pronounced than the results observed from the
pile, which ranges within 50 micro-strain and within the
accuracy range of the BOTDR system. The calculated strain
profiles are shown in 6 including the strain profile along the
borehole and the interpreted vertical heave is about 0.4 mm at
the top. Due to the limitation of the BOTDR system, it is
difficult to obtain the accurate vertical displacement profile
from such small strain measurement, and the data shown in
Figure 6 are the best approximation of the ground movement
from the borehole measurements.
(a)
(b)
(c)


