2360
Proceedings of the 18
th
International Conference on Soil Mechanics and Geotechnical Engineering, Paris 2013
Sloan 1995). This extension allows the MC model to capture soil
hardening and softening behavior based on a critical state concept.
3 MODEL CALIBRATION
To implement state-dependent dilatancy and friction angles in the
extended Mohr-Coulomb model developed here, the following
parameters must be selected through the model calibration process
(see Li et al. 2013 for further details):
(1)
Soil critical state line (CSL).
A power relation (Li and Wang
1998) can be more accurate than the conventional log-linear CSL
for sand under a confining pressure no more than 2MPa:
'
( )
c
a
p
e e
p
(6)
where e
c
is the critical void ratio at mean effective stress p
; e
is the
critical void ratio as mean effective stress diminishes to zero; p
a
is a
reference pressure taken as, p
a
= 101 kPa (atmospheric pressure) for
convenience; p
is the mean effective stress;
is the slope of CSL in
e versus (p
/ p
a
)
plane, which is similar to the conventional
compression index;
is a dimensionless constant. In this paper,
is
also termed as compression index and
is termed as compression
power for convenience. For sand,
is typically 0.75 and the
compression index can be estimated as 0.01C
u
where C
u
is the
coefficient of uniformity of sand; e
is estimated as
0.85
e
max
+0.15
e
min
where e
max
and e
min
are the maximum and
minimum void ratios of the sand.
(2)
Dilatancy parameter A for Eq. 2 or dilatancy parameters A, m,
n for Eq. 3.
For Eq. 2,
A
= 1.2 can be selected. For Eq. 3, m, n can
be estimated as 3.5, 0.75 respectively.
A
is to be calibrated by
experimental data and is typically in the range of 0.3 to 1.0.
(3)
Young’s modulus E and Poisson’s ratio
.
The stiffness of sand
varies with void ratio and stress state. Good predictions can be
made using the following equation (Hardin and Richart 1963; Wang
et al. 1990; Li et al. 1999; De and Basudhar 2008):
2
0
(2.97 )
'
1
a
e p
E E
e
p
(7)
where
E
0
is suggested as 6~10 MPa (Carraro et al. 2009). The bulk
and shear moduli,
K
and
G
can be calculated by the usual elastic
relations from
and
E.
4 IMPLENTATION OF CSMC IN LDFE
4.1 LDFE with RITSS technique
Large deformation FE (LDFE) analysis is conducted by remeshing
and interpolation technique with small strain (RITSS) (Hu &
Randolph 1998a, b). This approach is coupled with a finite element
package named AFENA (Carter & Balaam, 1995). To avoid large
mesh distortion and achieve large deformation simulation, a series
of small strain analysis increments (using AFENA) are combined
with fully automatic remeshing of the entire domain, followed by
interpolation of all field variables (such as stresses and material
properties) from the old mesh to the new mesh.
During the mapping of field variables, some mapping error is
inevitable. The fewer number of variables that must be carried to
describe the current material state, the less error will be introduced
after each mapping, thus the more accurate and convergent the large
deformation analysis. When CSMC constitutive model is
implemented to the LDFE/RITSS, void ratio
e
is the only extra
variable required to be interpolated in addition to the stress field.
Thus, numerical stability can be kept.
In the mesh generation/remeshing algorithm, the angle in one
triangle element is limited in the range of 26~111
. Two criteria are
used to trigger mesh refinement: (1) the distortion ratio
(which is
the shortest distance from the mid node to a straight line joining the
corner nodes, divided by the length of that straight line) exceeding
0.02; (2) the ratio between the maximum and minimum element
edge lengths exceeding 100.
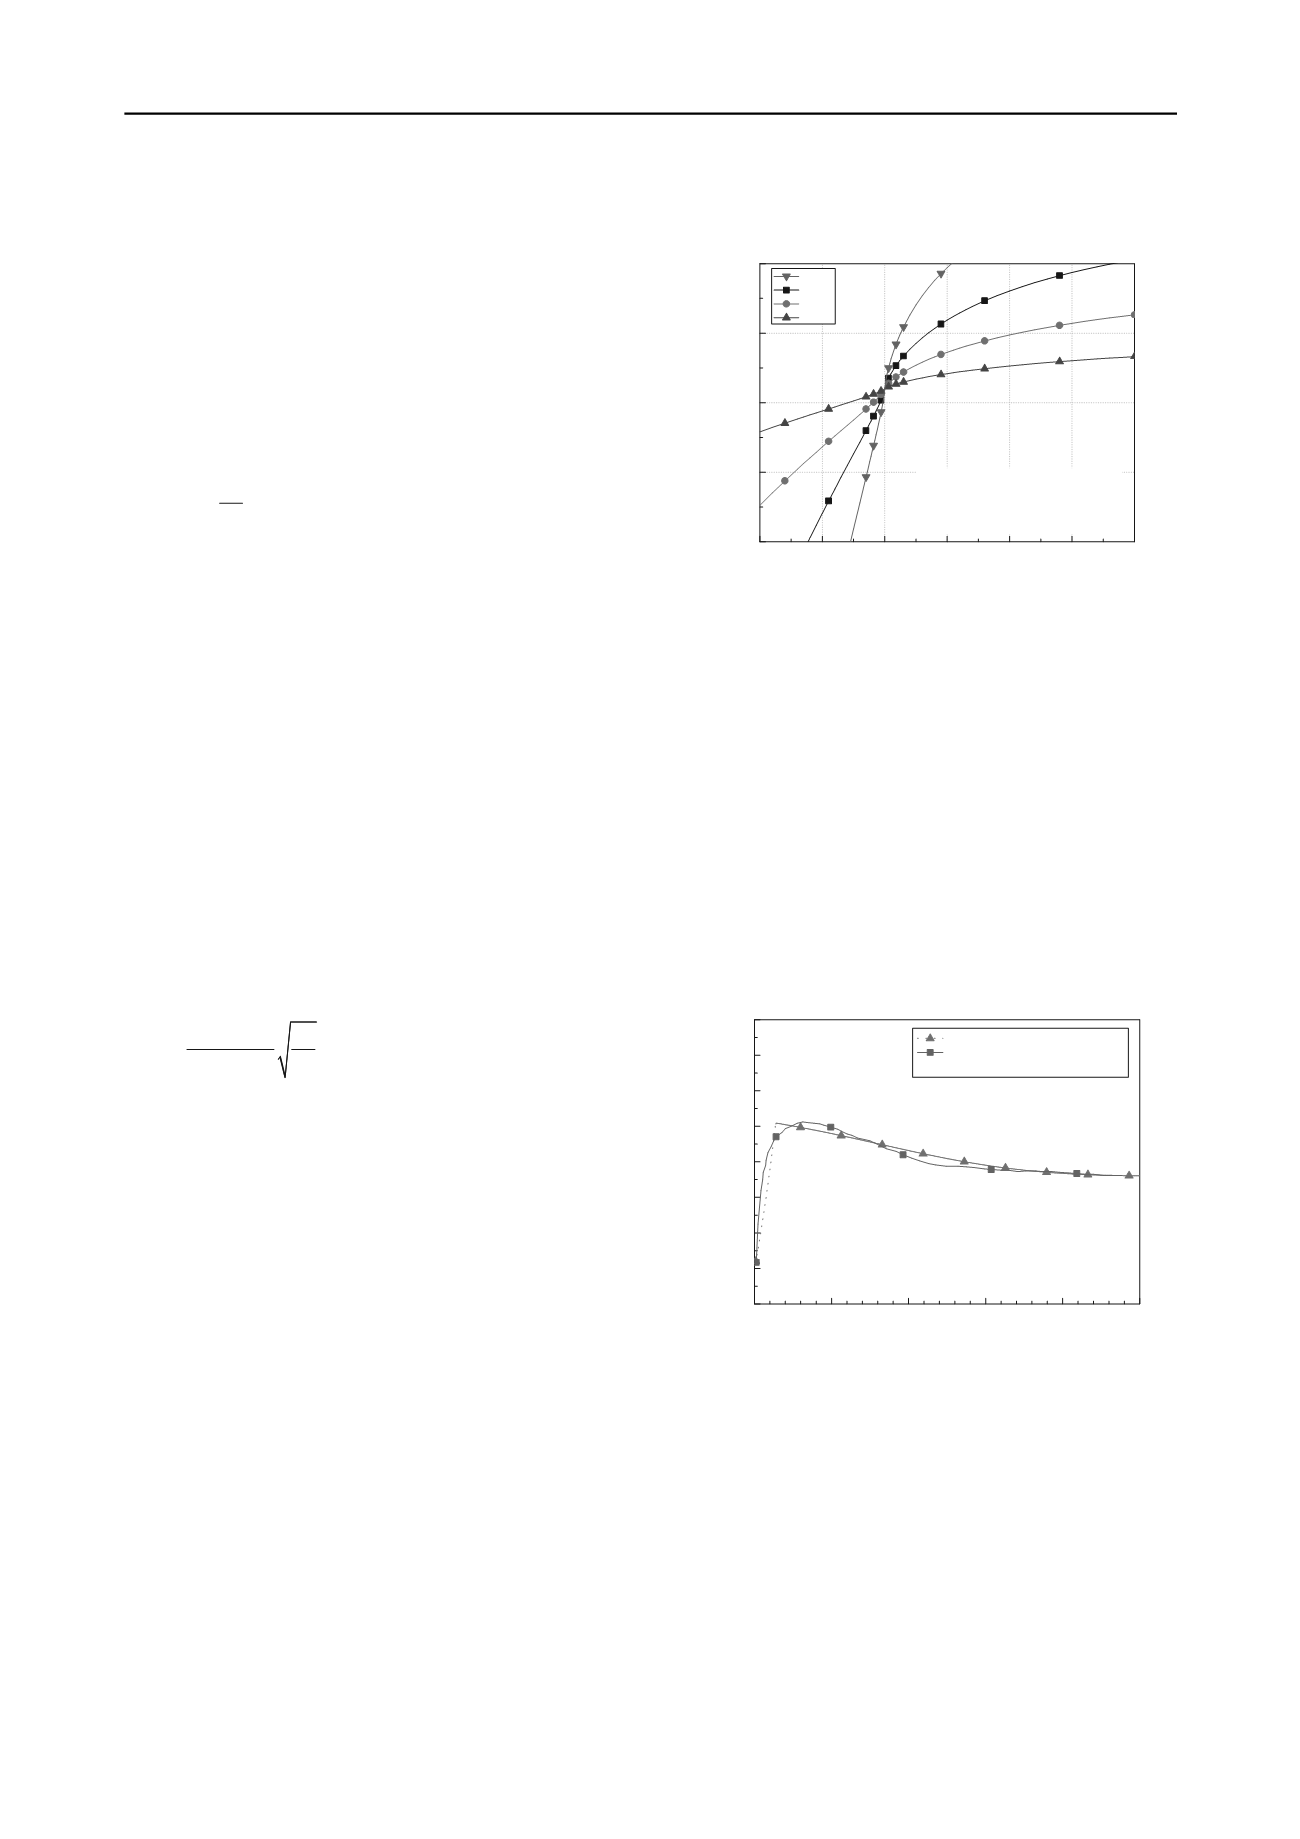
0.10
0.05
0.00
-0.05
-0.10
-0.15
-0.20
10
20
30
40
50
tan
=tan
+tan
c
tan
=
A
(1-exp(3.5*sign(
)*|
|
0.75
)
where
= e - e
c
,
c
=31
o
Friction angle
(
o
)
State parameter
A
=2
A
=1
A
=0.5
A
=0.2
Fig. 1 Effect of parameter
A
on friction angle
4.2 Biaxial test
The calibration of the model parameters is illustrated using a
single element simulation of a triaxial test and by a fully meshed
simulation of a biaxial test, both in Ottowa sand (Alshibli et al.
2003). The close match of the prediction and the experimental data
for a single element triaxial test provides the model parameters
A
=
0.36, m = 8, n = 0.75 (Fig. 2).
When the calibrated parameters were applied to the bi-axial
element test conditions, a much lower peak is observed (Fig. 3).
However, if the dilatancy angle is increased, as the parameter
A
in
equation 2 is raised from 0.36 to 0.6, the CSMC model shows a
similar peak as the experimental data (Fig. 3). Bolton (1986) has
also suggested that the dilatancy angle in plane strain test is about
1.6 times of that in triaxial test. This shows that different
parameters might be needed for triaxial and biaxial test conditions.
In the biaxial test, the softening behaviour is captured very well.
0
5
10
15
20
25
0
1
2
3
4
5
6
7
8
Principal Stress ratio
=
1
/
3
Axial strain
1
(%)
Single element triaxial test (A=0.36)
Laboratory drained triaxial test
Ottawa sand,
3
=100 kPa
Soil properties:
C
u
=1.4, D
50
=0.22mm, e
ini
=0.53, I
d
=0.9
Model parameters:
CSL: e
c
=0.64-0.014(p/101)
0.75
,
c
=36
o
Dilation: tan
=A(1-exp
sign(
)8|
|
0.75
)
Fig. 2 Model calibration by single element triaxial test
Fig. 4 depicts the shear band formed in a biaxial test using the
CSMC model. A single shear band is formed first at
2% axial
strain. Subsequently, a double shear band begins to form at
3%
axial strain and evolves gradually. This phenomenon is consistent
with the observation in Alshibli et al. (2003).
The soil in the shear band yields and dilates gradually to the
critical void ratio for this stress level, which is 0.61. The dilatancy
angle decreases continuously until the soil reaches the critical state,
mobilising
c
. However, the soil outside the shear band remains at
the initial void ratio, i.e. 0.54. The local strain in the shear band
exceeds the external strain. The single element simulation (Fig. 2)
shows a much slower decrease in the principal stress ratio after the
peak than the biaxial test (Fig. 3). This confirms that the measured
axial strain in laboratory tests that undergo localisation is only an
apparent value (Fig. 4).


