2364
Proceedings of the 18
th
International Conference on Soil Mechanics and Geotechnical Engineering, Paris 2013
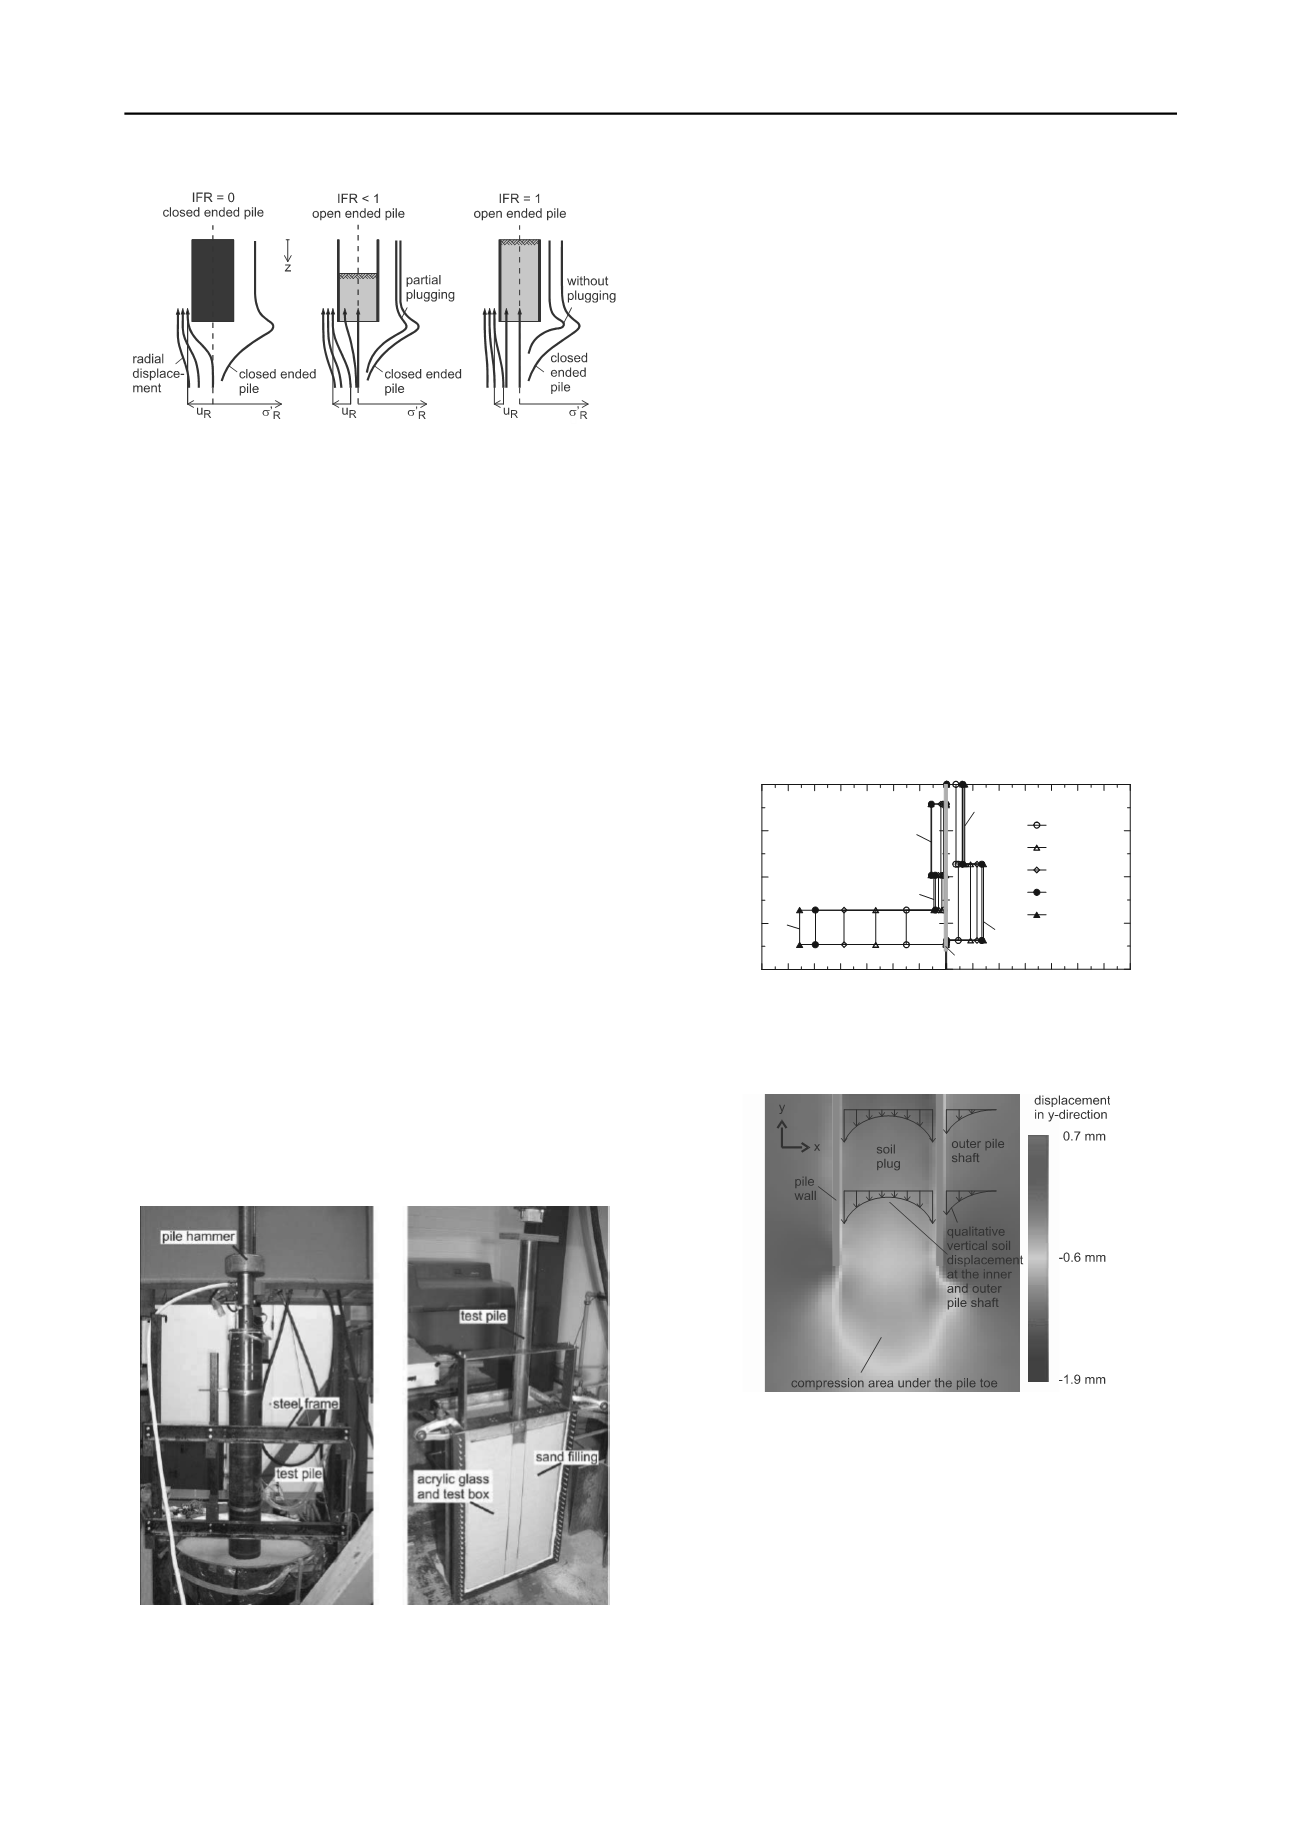
Figure 1. Distribution of the radial displacement u
R
and the radial stress
'
R
on the pile shaft depending on different IFR after White et al. 2005
3 EXPERIMENTAL INVESTIGATIONS
3.1
General
Different experimental investigations were carried out. The next
section gives a short overview of the laboratory test program
before the results are discussed. A detailed description and a
documentation of all test results is given in Lüking 2010.
3.2
Model Tests and Particle Image Velocimetry Tests
In the first test series a test pile of two pipe piles was
constructed. Both piles were only connected at the top. In all the
test pile had the following geometry: outer pile diameter 19 cm
and inner pile diameter 16 cm. The pile embedded depth after
driving the test pile into a sand box was about 140 cm. After
this a static pile test loading was carried out.
This test pile was equipped with different strain gauges.
Based on the measured strain
the inner shaft friction q
is
, the
outer shaft friction q
s
and the pile toe pressure q
b
could be
calculated. By means of a special constructed cone-penetration-
test (lab-CPT) the change in density and the displacement effect
of the pile installation could be examined.
In the second test series Particle Image Velocimetry (PIV)
tests were carried out. The PIV method is a contact free
measurement, in which displacement vectors can be identified.
Basics to this method can be found in Raffel et al. 2007.
The test pile in the second test series had an outer pile
diameter of 60 mm and a wall thickness of 2 mm. It was driven
behind an acrylic glass to an embedded depth of 50 cm. Figure
2 gives a perspective view of both test series which were mainly
carried out in non-cohesive soils.
Figure 2. Perspective view of a) test pile of the first test series and b)
test pile of the second test series (PIV)
3.3
Results of the experimental test series
In general the experience on the pile bearing behaviour
regarding different influence factors could be confirmed. With
an increasing relative density and increasing stress level the pile
bearing capacity is also increasing.
The change in density around the test pile was lower in
dense sands than in loose sands, which could be identified by
different tests with the lab-CPT. The base resistance of the lab-
CPT inside the soil plug was up to 80 MPa. A higher density of
the soil tends to a higher IFR. Nevertheless the IFR does not
converge to a fixed value. It was increasing and also decreasing
during driving which means that the soil inside was plugging
and loosening again. This phenomenon was also identified
during the static pile test loading. However during both test
series the value never reached IFR = 0. The minimum was
IFR = 0.2. This means that only a partially plugged soil could
occur and based on this the concept of a monolithical soil plug
should be analyzed critically.
Figure 3 shows the distribution of the inner and outer shaft
friction at different load levels from the first test series. The
outer shaft friction is increasing with higher pile length as
expected. In contrary the inner shaft friction is very high on a
length which approximate two pile diameters. Above this the
inner shaft friction in section 1 and 2 is very low and it looks
approximately independent of the load level. The increasing of
the inner shaft friction in section 3 is an indication for a (partial)
plugging effect of the soil.
0 50 100 150 200 250 300 350
outer skin friction q
s
[kN/m
2
]
load levels
30.1 kN
60.2 kN
90.2 kN
120.3 kN
135.3 kN
160
120
80
40
0
pile length L [cm]
350 300 250 200 150 100 50
inner skin friction q
is
[kN/m
2
]
pile wall
section a
section b
section 1
section 2
section 3
Figure 3. Distribution of the inner and outer shaft friction q
is
and q
s
for
different load levels in non-cohesive soils.
Figure 4 shows the vertical displacement of the soil on the
lowest two pile diameters exemplary for the second test series.
Figure 4. Distribution of the vertical displacements in the soil at the pile
toe in the second test series in non-cohesive soils.
There an inhomogeneous distribution could be identified.
Near the inner pile shaft the vertical displacement is much
higher than in the middle of the soil plug. This distribution
occurs during driving independently of all investigated
boundary conditions in the second test series. It is another
indication that the load transfer takes place by the inner shaft
friction and not by an additional base resistance underneath the
soil plug. This assumption can also be supported by the
comparable distribution of the inner and outer shaft frictions,
see also in Figure 3. For a monolithic approach the vertical
displacement had to be more constant which could not be
observed. Furthermore the tests show that these results in non-
cohesive soils cannot be transferred easily to cohesive soils. It


