2366
Proceedings of the 18
th
International Conference on Soil Mechanics and Geotechnical Engineering, Paris 2013
The best compliance for the adaption factors was found by a
hyperbolic correlation, see Eq.4 and 5.
5.4
Comparable Calculations
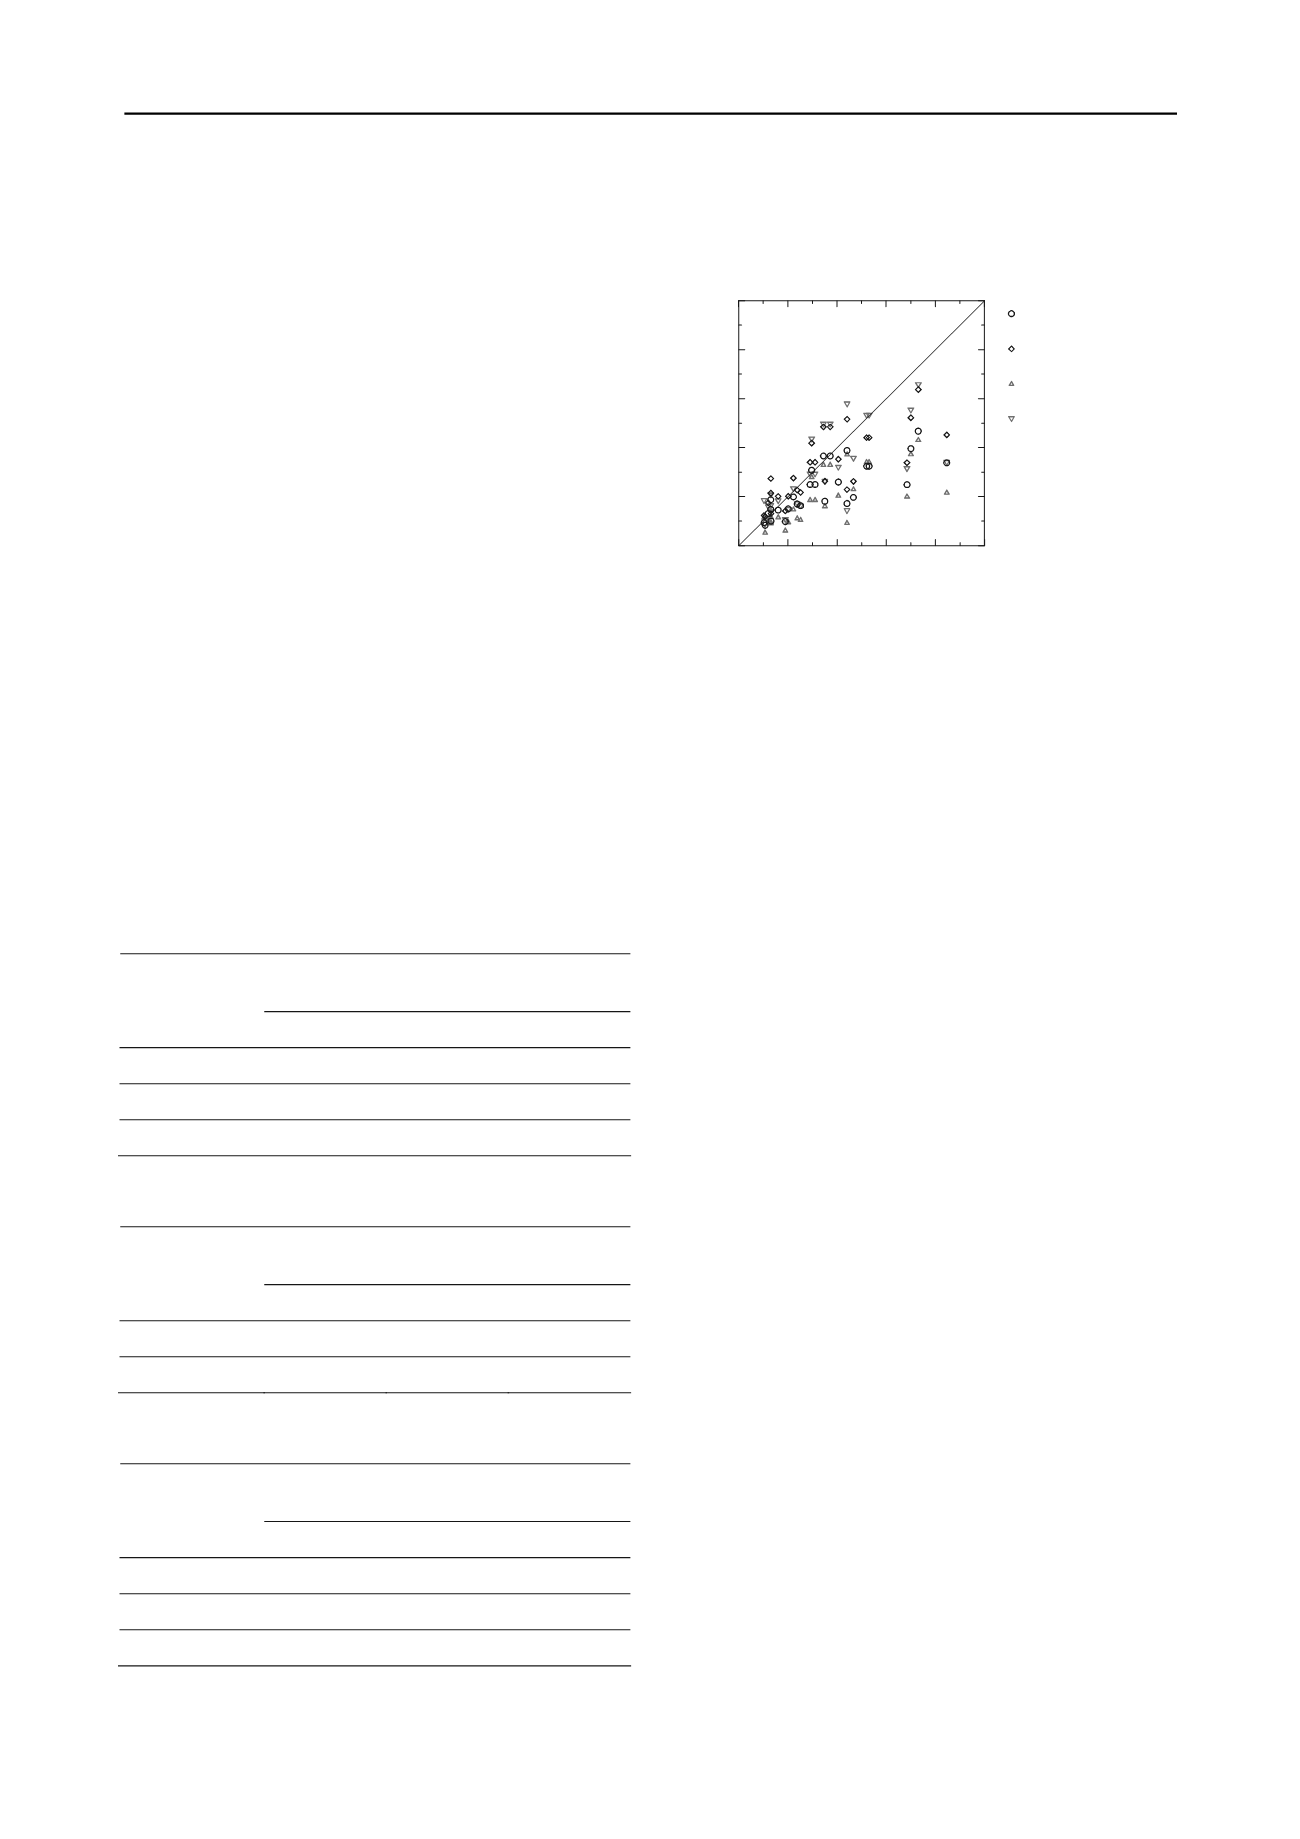
Figure 7 gives an overview of the caclulation results of both
methods compared with the results of the pile load tests.
a
D
b
e
2.1
95.0
D
63.0
(4)
0
2
4
6
8
10
R
m
[MN], static pile load test
0
2
4
6
8
10
R
cal
[MN], calculation methods
calculation method 1,
10 % quantile
calculation method 1,
50 % quantile
calculation method 2,
10 % quantile
calculation method 2,
50 % quantile
a
s
e
1.1
(5)
D
a
: outer pile diameter
5.3
Calculation Method 2
Calculation method 2 is based on an analysis of 28 static pile
loading tests with pile diameters up to D = 1.2 m. In contrary to
calculation method 1 this method derived new values of
experience for each part of pile resistance for the 10 % and the
50 % quantile. Eq.6 gives the basic equation.
s ks a ka is kis k
A qA q A qR
,
,
,
(6)
R
k
: characteristic pile resistance
q
is,k
: characteristic inner pile skin friction after Table 1
q
a,k
: characteristic pile toe pressure of the pile contact
area after Table 2
Figure 7. Calculation results for the characteristic pile resistance R
cal
of
both calculation methods in comparison to results R
m
of static pile load
tests
Figure 7 shows that the requirements of the calculation
methods for the 10 % and 50 % quantile are fully accomplished.
Further calculations and variations of parameters are given in
Lüking 2010.
q
s,k
: characteristic outer pile skin friction after Table 3
A
is
: inner shaft area of the pile
A
a
: contact area of the pile
A
s
: outer shaft area of the pile
This method is valid for pile diameters from 0.3 m up to 1.2
m only in non-cohesive soils. The first values of the experiences
in the following tables are the 10 % quantile and the second are
the 50 % quantile.
6 SUMMARY
Table 1. Values of experience for the characteristic inner shaft friction
is,k
depending on the pile settlement and the resistance of the CPT
The load transfer inside a plug of an open-ended displacement
pile was investigated by experimental, numerical and statistical
methods. It was shown that the load transfer takes place by
compression arches. A fully plugged soil could not be
identified.
q
Characteristic inner shaft friction q
is,k
[kN/m
2
]
at a cone penetration resistance q
c
[MN/m
2
]
Settlement s
7.5
15
≥ 25
s = 0.035•D
a
15/
÷ 35/
35/
÷ 55/
50/
÷ 67.5/
s = 0.1•D
a
30/
÷ 50/
60/
÷ 80/
90/
÷ 100/
with
= 2•PLR, see Eq. 2
7 REFERENCES
API RP 2A-WSD 2007.
Recommended Practice for Planning,
Designing and Constructing Fixed Offshore Platforms - Working
Stress Design
, 21st Edition, American Petroleum Institute,
Washington
Brucy F., Meunier J. and Nauroy J.-F. 1991.
Behavior of Pile Plug in
Sandy Soils during and after Driving.
Proceedings of the 23rd
Offshore Technology Conference, OTC 6514, Vol. 1, pp 145-154
Table 2. Values of experience for the characteristic pile toe pressure q
a,k
epending on the pile settlement and the resistance of the CPT
Dijkstra J., Broere W., and van Tol A. F. 2006.
Numerical Investigation
into Stress and Strain Development around a Displacement Pile in
Sand.
Proceedings of the 6th European Conference on Numerical
Methods in Geotechnical Engineering. NUMGE 06. pp 595-600
d
Characteristic pile toe pressure q
a,k
[kN/m
2
] at a
cone penetration resistance q
c
[MN/m
2
]
Settlement s
7.5
15
≥ 25
s = 0.035•D
a
650
÷ 1.200
1.300
÷ 1.750 1.750
÷ 2.800
s = 0.1•D
a
1.100
÷ 2.000 2.000
÷ 3.000 2.800
÷ 4.800
Empfehlungen des Arbeitskreises „Pfähle“ EA-Pfähle 2012.
Empfehlungen des Arbeitskreises „Pfähle“; 2. Edition, Ed.
Arbeitskreis „Pfähle“ of the German Society of Geotechnics. Ernst
& Sohn. Berlin
Jardine R. J., Chow F. C., Overy R. F. and Standing J. R. 2005.
ICP
Design Methods for Driven Piles in Sands and Clays.
Thomas
Telford, London
Kempfert H.-G. 2009. Pfahlgründungen. Chapter 3.2 in: Grundbau-
Taschenbuch. 7th edition. Part 3. Ernst & Sohn. Berlin. pp 73-277
Table 3. Values of experience for the characteristic outer shaft friction
s,k
depending on the pile settlement and the resistance of the CPT
Lüking J. 2010.
Tragverhalten von offenen Verdrängungspfählen unter
Berücksichtigung der Pfropfenbildung in nichtbindigen Böden.
Schriftenreihe Geotechnik, University of Kassel, Issue 23.
q
Lüking J. and Kempfert H.-G. 2012.
Untersuchung der Pfropfenbildung
an offenen Verdrängungspfählen.
Bautechnik 89, Issue 4, pp 264-
274.
Characteristic outer shaft friction q
s,k
[kN/m
2
] at
a cone penetration resistance q
c
[MN/m
2
]
Settlement s
7.5
15
≥ 25
s
g*
15
÷ 25
30
÷ 50
50
÷ 70
s = 0.1•D
a
20
÷ 30
35
÷ 60
55
÷ 75
with s
g*
[cm] = 0.5•R
s,k
[MN] ≤ 1 [cm]
Paik K.-H. and Lee S.-R. 1993.
Behavior of Soil Plugs in Open-Ended
Model Piles Driven into Sands.
Marine Georesources and
Geotechnology, Vol. 11, pp 353-373
Raffel M., Willert C., Wereley S. and Kompenhans J. 2007.
Particle
Image Velocimetry - A Practical Guide.
Second Edition, Springer-
Verlag, Berlin Heidelberg New York
White D. J., Schneider J. A. and Lehane B. M. 2005.
The Influence of
Effective Area Ratio on Shaft Friction of Displacement Piles in
Sand.
Proceedings of the International Symposium on Frontiers in
Offshore Geotechnics, Balkema, Rotterdam, pp 741-747


