2357
Technical Committee 209 /
Comité technique 209
Bottom face nodes were fixed in vertical displacement, and
side face nodes were fixed in horizontal displacement. Coulomb
criterion interface elements were applied in contacting faces
between the bucket body and soil in order to model sliding and
separation behaviour. Shear and normal stiffness values were
set to 200 MPa/m which was larger than ten times the elastic
modulus of surrounding soil (Itasca, 2005).
The analysis was run in three stages. The first stage
simulated the initial K
0
soil condition. The second stage
simulated the installation of the bucket in the soil. The third
stage was the loading stage where the top of the loading tower
was horizontally moved in every step and unbalanced forces
were calculated as the resistance of the foundation.
The ramping algorithm was used for the loading velocity
control, in which the loading velocity was linearly increased
with step to u
d,max
per step (1�10
-6
m/step in this study) till
prescribed steps were run and kept constant afterwards (Itasca,
2012).
3.2
Analyses and results
Cases considered in this study are summarized in Table 2 and a
plot of displacement contour for C2 case is shown in Figure 6.
Table 2. Analysis cases
Items
Values
A1. Reference case
Parameters in Table 1
A2. Bucket weight and
vertical load
Bucket weight 2220 kN
Vertical load 5750 kN
B1. Horizontal boundary
distance from model center
(5D for reference case)
2D
C1, C2. Elastic modulus
of SM layer (E, MPa)
20, 5.0
D1, D2. Internal friction
angle (φ)
38.7, 28.7
E1. Dilation angle (ψ)
3.7
F1. Cohesion (c, kPa)
0.1
G1. C2 + F1
Figure 6. Contour of displacement for case C2
The prototype of the centrifuge test was modeled with larger
thickness in the wall and the top plate than the preliminary
design due to limitations in fabrication. The vertical rod and the
connecting part between the bucket body and the rod were
designed to have sufficient stiffness and strength for the
centrifuge. These resulted in a heavier prototype and vertical
load than the target structure in the preliminary design.
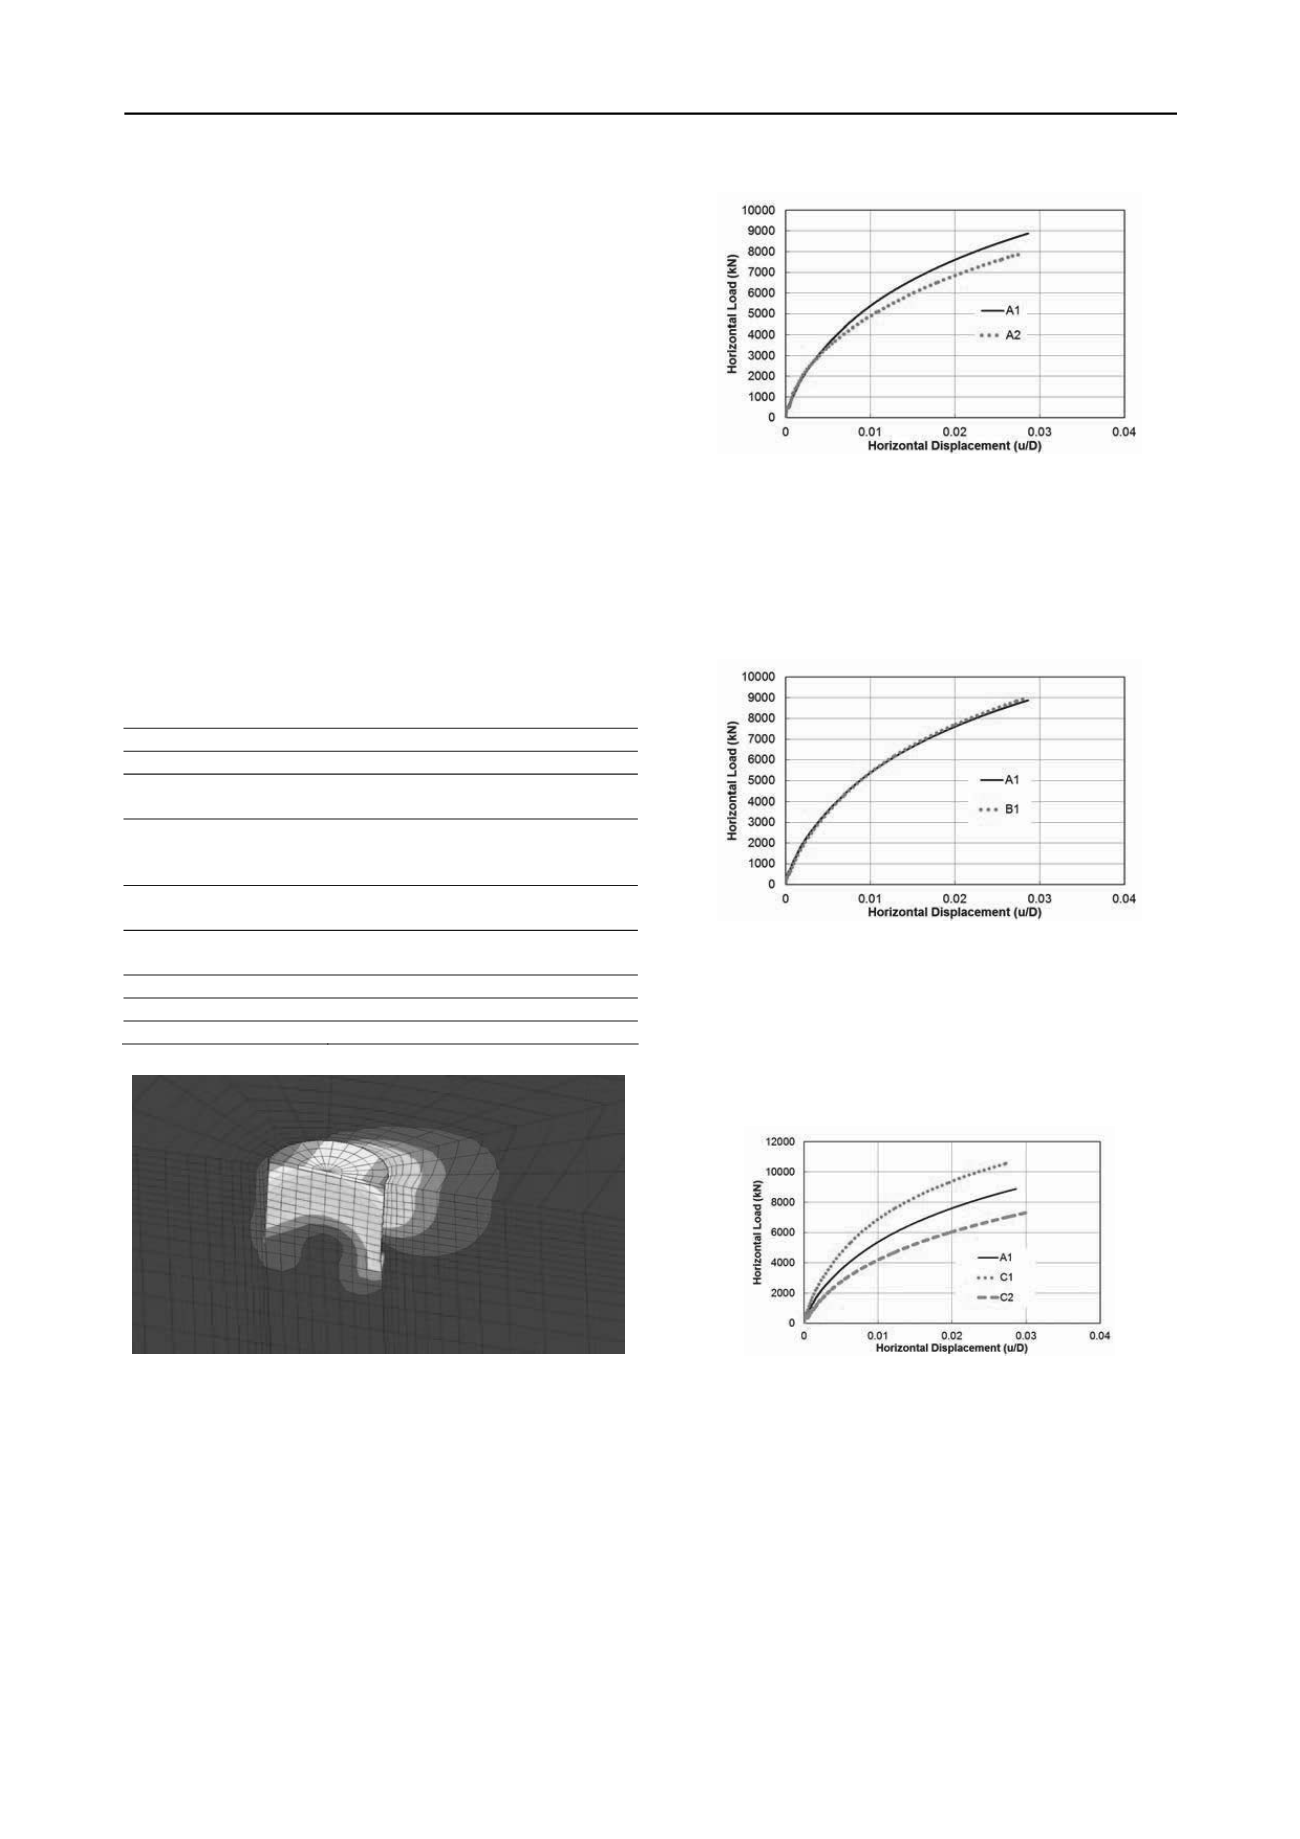
Therefore, the effect of heavier structure weight was analyzed in
the numerical analysis. The load – displacement curve is shown
in Figure 7. Slight decrease in the resistance was observed for
the reduced weight and vertical load, after around 0.003 ~
0.005D.
Figure 7. Load – displacement curves for different foundation weight
and vertical load
The centrifuge model soil container had a radius of 447.5
mm, which was about two times the diameter of the model
foundation. The results between 2D and 5D horizontal boundary
distances are compared in Figure 8. The difference was
negligible between the horizontal boundary distances
considered.
Figure 8. Load – displacement curves for different horizontal boundary
distances
Different elastic moduli resulted in a noticeable variation in
the slopes of the curves (Figure 9). Therefore, proper estimation
of the elastic modulus and application in the numerical model
are thought be important for the load – displacement behaviour
in the conditions of this study.
Figure 9. Load – displacement curves for different elastic moduli of the
silty sand layer
The effect of variations in the internal friction angle and
dilation angle of the silty sand layer was considered (Figure 10).
Slight changes in slopes were observed after around 0.005 ~
0.01D, but they were found to be relatively small in the
displacement range considered in this study.


