2368
Proceedings of the 18
th
International Conference on Soil Mechanics and Geotechnical Engineering, Paris 2013
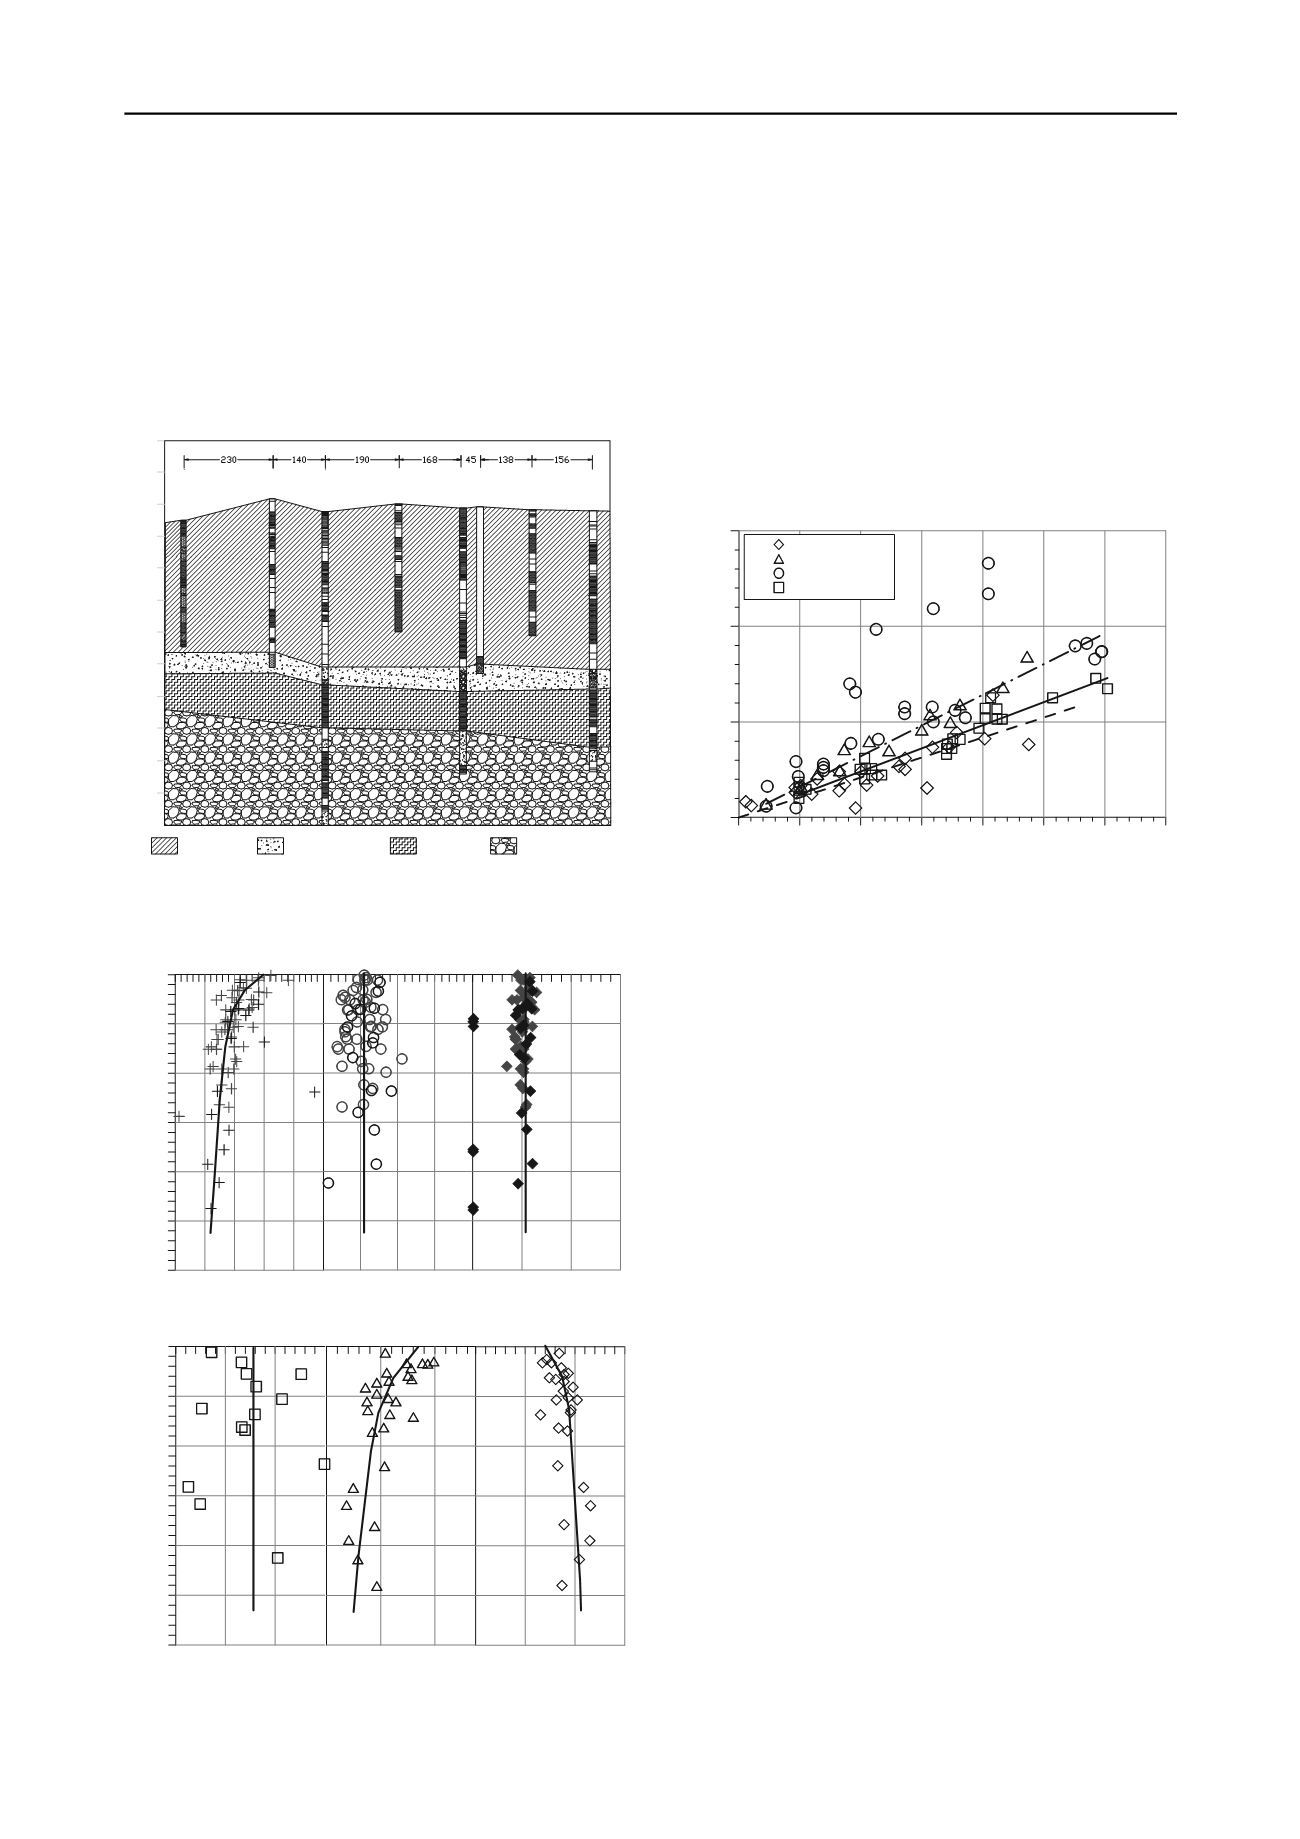
Some of the geotechnical indices and properties obtained
during the site investigations are shown in Figure 3. The fine
grained materials classify mainly as CL (low plasticity clays)
and ML (low plasticity silts). Water content commonly exceeds
the liquid limit in the upper part of the soft silty clay unit, but at
lower levels it is close to the plastic limit, an indication of the
self weight consolidation of the sediments. Void ratios range
between 0.8 and 1.0 in the upper clay stratum. Dry densities
vary from 1.2 Mg/m
3
at the upper clay levels to 1.8 Mg/m
3
at
deeper locations.
AS-6
AS-5
S-6
AS-4
S-5 Apz-14 AS-3
Upper level of
silt and clays
Intermediate level of
gravels and sands
Lower level of
clays
Lower level of
gravels and sands
0
-110
-100
-90
-80
-70
-60
-50
-40
-30
-20
-10
Figure 2. Soil profile under the caisson breakwater
10 20 30 40 50
w (%)
120
100
80
60
40
20
0
Depth (m)
20 30 40 50
w
L
(%)
0 20 40 60
w
P
(%)
0.8 1.2 1.6 2
d
(Mg/m
3
)
0 1 2
I
L
(%)
120
100
80
60
40
20
0
Depth (m)
0.4 0.8 1.2
e
Figure 3. Basic soil properties
In the low permeability foundation soils, stability is
controlled by the undrained shear strength (c
u
). In the normally
consolidated range, this parameter is largely proportional to the
consolidation effective vertical stress. Undrained shear strength
has been examined by means of laboratory and in situ tests.
Unconfined compression tests of clay samples provided a
value of c
u
=0.215
’
v
. However, sample disturbance and suction
loss may lead to an underestimation of the real value (e.g.
Tsuchida, 2000). Simple shear tests performed by NGI provided
a value of c
u
=0.25
’
v
. quite consistent with the results of CPTU
tests. Anisotropically consolidated triaxial tests (compression
and extension) yielded a range of c
u
=0.21 – 0.33
’
v
, the larger
values associated with compression tests. A summary of results
obtained is presented in Figure 4. The unusually large values of
undrained strength obtained in some vane tests were probably
due the occasional presence of sand lenses or laminations.
0 100 200 300 400 500 600 700
' v : kPa
0
100
200
300
c u : kPa
Unconfined comp.
Triaxial test
Vane test
CPTU tests
c
u
=0.215
'
v
c
u
=0.32
'
v
c
u
=0.25
'
v
Figure 4. Undrained shear strength. Summary of results
It was also found that specimens sheared under normal
effective stresses reproducing in situ stress conditions showed
somewhat higher strength ratios than specimens consolidated to
higher effective stress values. This is an indication of some
modest overconsolidation/structure effects due to natural creep
or aging phenomena. However, the additional stresses applied
by the caissons and fills will take the soil in situ to a normally
consolidated state. Therefore, a conservative attitude is favoured
for the selection of the undrained stress ratio. The static design
of the breakwater was eventually performed using a value of
c
u
=0.25
’
v
.
3 BREAKWATER DESIGN
The conventional breakwater design was performed using finite
element analysis as the most efficient method to consider
automatically the variation of undrained shear strength
throughout all stages of construction. The following phases
were considered: i) dredging and bench construction on the new
soil surface, ii) caisson placement and filling, iii) construction
of the superstructure, and iv) backfill behind the caissons to
create a new quay zone. Although all potential limit states were
considered, it should be pointed out that the use of finite
element analysis readily identifies the most critical failure
mechanism at every stage of the analysis. It should also be
noted that the gain in undrained shear strength during each one
of the construction phases was a critical feature with respect to
the stability of the subsequent construction phase.
The wave and uplift forces due to storm loading in the
different phases of construction are listed in Table 1. They were
derived from physical model tests using the specific breakwater
design. Wave forces depend on two factors: the height of the
superstructure that provides the surface on which the wave
impact acts and the wave height that in turn depends on the
intensity of the storm. It can be observed that the wave height
(and hence the storm intensity) is lower in Phase II. This is due
to the temporary character of this Phase that makes it less likely


