2369
Technical Committee 209 /
Comité technique 209
that an extremely large storm will occur during that limited
period. Probability analysis based on available time series
provides the design storm to be used in each particular stage.
For each construction stage, a variety of factors of safety
were used to assess the degree of stability of the breakwater
affecting either loads or soil strength parameters. In the former
case, wave caisson weight and storm wave loads were
considered both jointly and separately. The values of safety
factors were assessed in relation with the perceived uncertainty
of the parameters involved. Thus, a higher factor of safety was
demanded when only the wave action was considered due to the
much larger uncertainty of the load magnitude associated with
the storm. In fact, uncertainty affects both storm intensity and
the actual effect on the caisson. The final design of the
breakwater is depicted in Figure 5. Note the wide rockfill bench
required for stability. An example of the failure mechanism in a
particular instance of the analysis is shown in Figure 6.
Table 1. Wave and uplift forces acting on the caissons breakwater at
different phases of construction
Phase
Shoulder
height
(m)
Wave
height
(m)
Wave
period
(s)
Wave
force
(kN/m)
Force
height
(m)
Dynamic
uplift
(kN/m)
II
No
5
9
1036.3
9.48
525.1
III
+6
5.91 12.7 1436.1 10.36 878.2
IV
+11
8.04
12.7
748.9
6.10
766.2
CAISSON
RUBBLEMOUND
172.27
-26.00
RIPRAP300kg
SEAWARDSIDE
RIPRAP 4 ton
CONCRETEBLOCK
RIPRAP 300kg
0.00
-21.00
-23.00
-13.75
-15.00
-13.00
-22.00
-18.00
0.00
+11.00
+3.00
Figure 5. Design of the caisson breakwater.
Figure 6. Failure mechanism for Phase III under storm loading.
4 CYCLIC SHEAR STRENGTH
However, breakwaters are also subjected to cyclic wave
loading. Storms are the primary source of energy that may cause
cyclic mobility or, in extreme conditions, liquefaction of
foundation soils. Even if such extreme events do not occur,
undrained shear strength may be lower after a severe episode of
cyclic loading. Consequently, clay behaviour under cyclic
loading was also investigated in the laboratory by performing
cyclic simple shear and triaxial tests (on isotropically and
anisotropically consolidated specimens). Data from simple
shear tests were favoured because they appear to correspond
more closely to the actual breakwater foundation conditions
during storm loading.
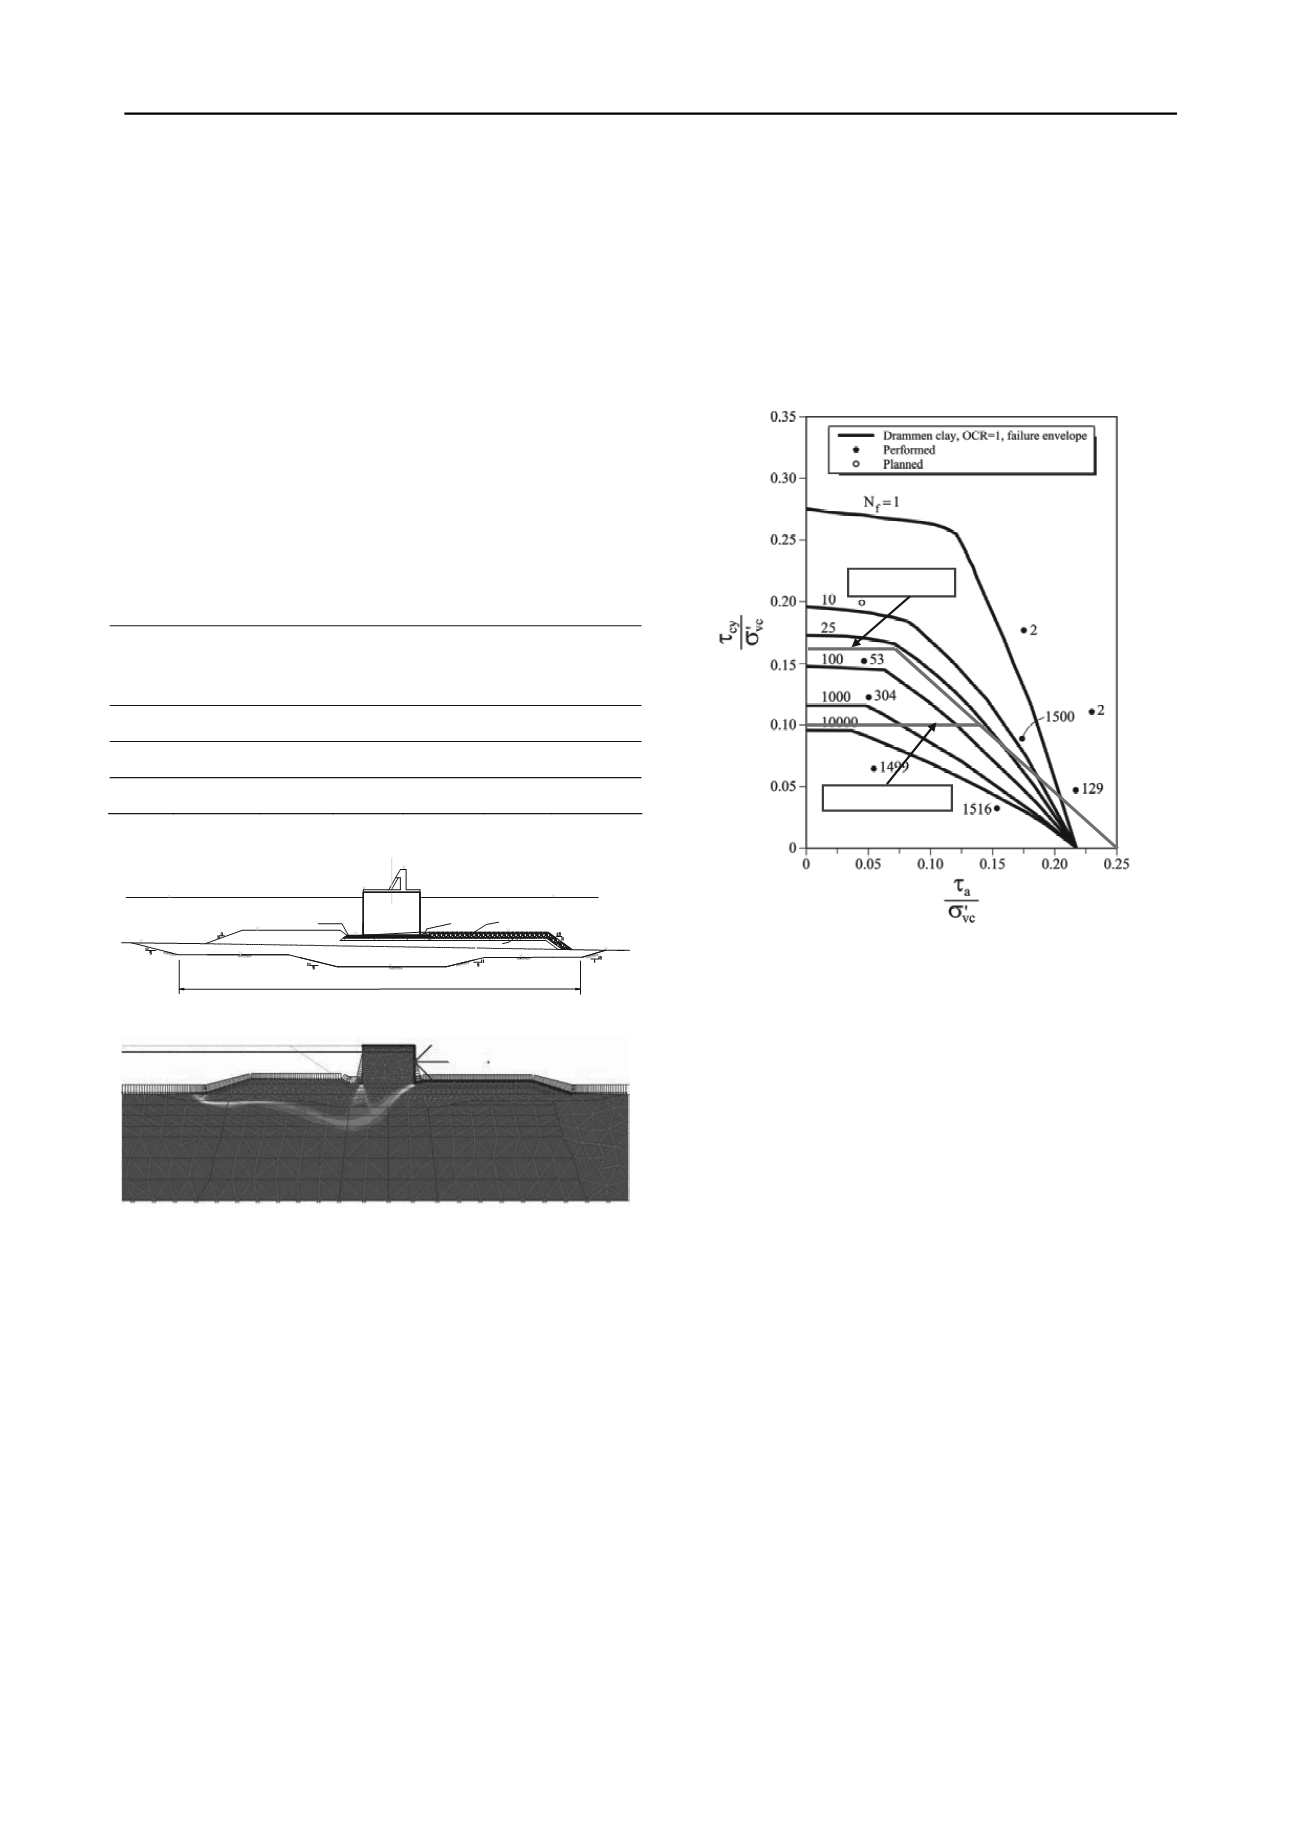
Results from these tests can be usefully summarized using
interaction diagrams such as that shown in Figure 7. This
diagram shows a relationship between the normalized average
shear stress
a
/
’
vc
, normalized cyclic shear stress
cy
/
’
vc
and
the number of cycles to reach the cyclic mobility criteria. Also,
results obtained from simple shear testing on the plastic
Drammen clay (Goulois et al, 1985) are shown for reference.
Failure occurs for a given combination of normalized cyclic
and average shear stress. Figure 7 shows the approximate
bounds of these combinations for two different loading
conditions (40 impacts and 1000 impacts). The normalised
cyclic shear stress
cy/
’
vc
, for low values of the normalized
average shear stress, is close to 0.17 for 40 cycles and to 0.10
for 1000 cycles. A second static bound is provided by the
relationship
cy
/
’
vc
+
a
/
’
vc
=0.25, which is based on the
previous discussion on static undrained strength.
40 impacts
1000 impacts
Figure 7. Interaction diagram from direct simple shear tests (NGI,
2002).
5 SIMPLIFIED ANALYSIS USING THE INTERACTION
DIAGRAM
An example of the simplified stability analysis concerning
Phase III of construction is presented in this section. The design
storm established for this Phase is summarised in Table 2 that
contains the number of waves of different heights corresponding
to a succession of storm intensities with different durations and
different significant wave heights.
It is assumed that the design storm can be represented as the
application of a number of wave impacts of a certain magnitude.
Then, a static analysis can be used to identify areas in the
foundation soil where the stress state exceed the criteria of
unstable stress defined by the interaction diagram. Naturally, to
use the information contained in the interaction diagram, it is
necessary to transform the variable wave loads of the storm into
a series of cycles of uniform magnitude. This transformation
always involves, to a certain extent, a degree of uncertainty and
approximation. It is therefore advisable to adopt a measure of
conservatism.
With this approach, two loads intensities were selected from
the wave magnitudes shown in Table 2: a large load of 1011.5
kN/m and a smaller load of 341.6 kN/m. The former is assumed
to act forty times and the latter five thousand times. The limit
criteria corresponding to those two numbers of cycles have been
indicated in Figure 7.
Now, it is possible to compute, using a conventional static
finite element analysis and applying the corresponding wave
loads, the points at which such criteria are exceeded, indicating
the possibility that, in those zones, a degree of cyclic mobility
occurs with a potential reduction of the undrained shear
strength. A quite conservative assumption is that the operational
undrained shear strength reduces to the residual value of c
u
. The
foundation zones affected are shown in Figures 8 and 9. They


