2291
Technical Committee 208 /
Comité technique 208
composed of granite, the geological structure of Umyeon
Mountain is made up of gneiss. Therefore, the prolonged
rainfall one month prior to the debris flow event might have
caused saturation of the ground and made it more vulnerable to
collapse. Average return period of rainfall for the duration of
one hour and more was about 120 and 20 year for the
Namhyeon and Seocho stations, respectively.
Figure 5. Locations of automatic weather stations around Umyeon
Mountain
Figure 6. Locations of automatic weather stations around Umyeon
Mountain
3 RISK ANALYSIS
3.1 Landslide susceptibility assessment
There are two general approaches for landslide susceptibility
assessment. The first approach is based on a physical
mechanism and the second is based on a statistical method. In
this work, statistical model developed in Gangneung-Wonju
national university was used (Lee et. al., 2012). This model can
directly yields the probability of landslide because the equation
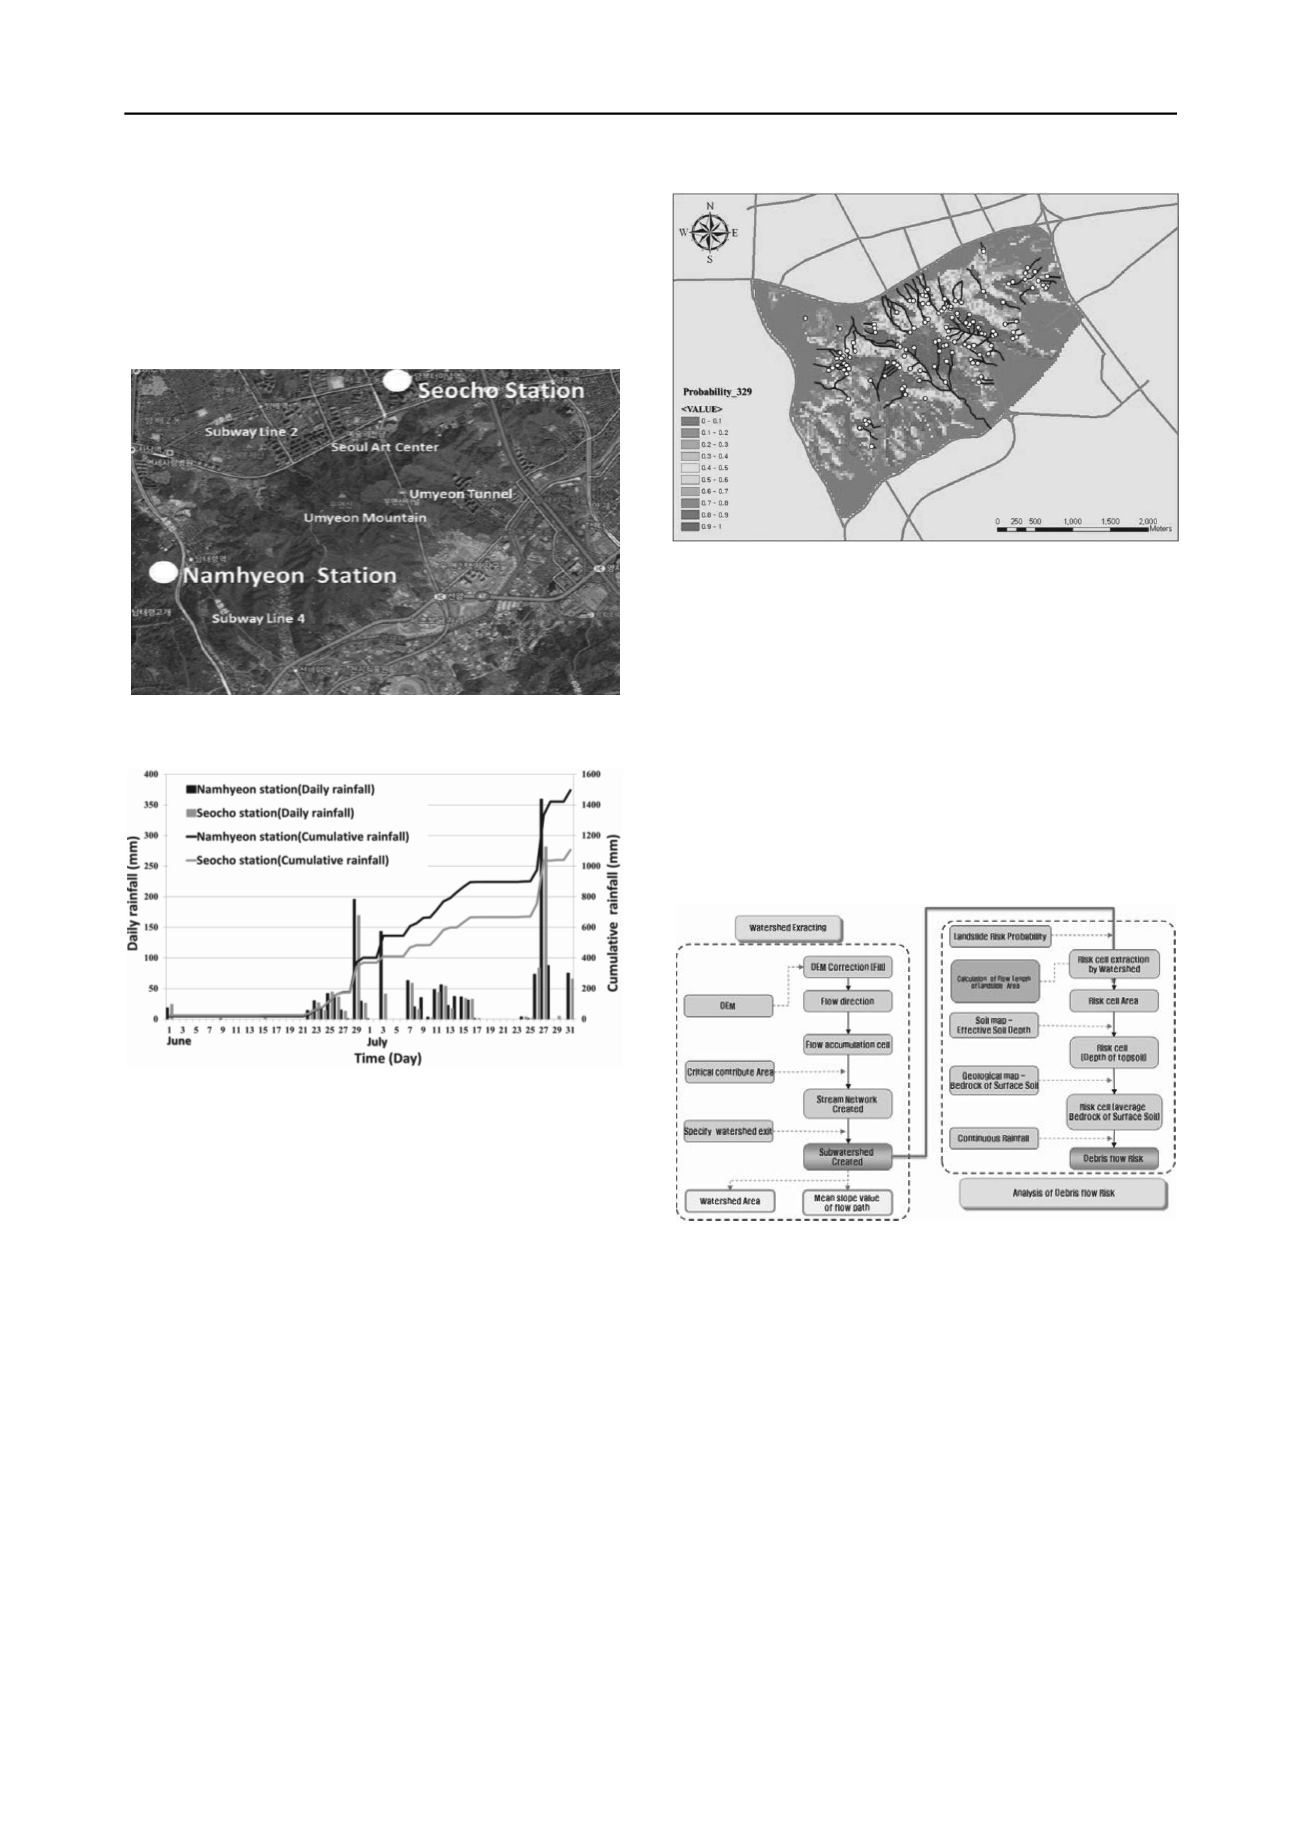
of the model was derived from logistic regression. The landslide
susceptibility map is created by using GIS data which includes
geomorphological characteristics, soil properties, rainfall,
vegetation, and forest fire history. Figure 7 shows the landslide
susceptibility map which was made with 329 mm of
accumulated rainfall for 3 days, and the field survey result
which included the initial slope failure and flow path of the
debris flows was overlayed. As shown in figure 7, most of the
slope failures were occurred in highly susceptible regions for
landslide.
Figure 7. Landslide susceptibility map with field survey results
3.2 Debris flow risk assessment
A methodology for the evaluation of debris flow risk in a
watershed incorporated with GIS was proposed in this work.
This model predicts the debris flow hazard risk on any given
watershed. The model was developed using statistical analysis
of debris flow hazard data in Korea from 2005 to 2011. These
data was obtained from field surveys, disaster reports on
national roads of Korea, aerial photos, and digital maps. Each
set of data in the database includes geomorphologic factors
influencing debris flow size, rainfall information, bedrock
types, and run out distance of the debris. Figure 8 shows flow
chart of the methodology.
Figure 8. Flow chart of the debris flow risk assessment
Debris flow hazard probability is calculated by equation (1).
Debris flow hazard probability = (1)
where Logit(p) = -5.4 -1.3E-5×(area indicating landslide
probability higher than 50%×depth of surface soil) +0.005×
(amount of continuous rainfall) +4.522×(bedrock type) +2.1E-
8×(mean slope of flow path-area of watershed). Table 1 shows
the data and data acquisition method used in the model.
Based on the analysis of DEM (Digital Elevation Map) of
Umyeon Mountain, 31 watersheds can be generated as shown in
Figure 9. The probability of debris flow hazard for individual
watershed in Umyeon Mountain is summarized in Table 2. As
shown in Table 2, most of the watershed where debris flow took
place showed high probability for the debris flow hazard except
one watershed (Seonbawi) where debris flow hazard did not
occur. Unlike the other watersheds, the bedrock of Seonbawi
watershed was granite and the bedrock condition might be one
of the important factor in the occurrence of debris flow. These
results confirmed the applicability of the developed risk
assessment model for the landslide and debris flow hazard.
Table 1. Data of the debris flow hazard occurrence


