2301
Technical Committee 209 /
Comité technique 209
tests. SOLCYP will be presented and discussed at the TC209
workshop and recorded for publication. Therefore only some
key aspects are described below to avoid duplication.
There are four axial load magnitudes: the mean
Q
mean
and
the half-amplitude of the cyclic load
Q
cyclic
define the maximum
Q
max
= Q
mean
+ Q
cyclic
and the minimum
Q
max
= Q
mean
- Q
cyclic
pile loads. These loads are typically referenced to the ultimate
pile capacity in tension
Q
T
or compression
Q
UC
. The ultimate
capacity and the capacity under cyclic load is determined at a
limiting displacement (0.1
D
or less) or due to an increasing rate
of displacement; either continuing displacement after a static
load increment or the cyclical displacement rate (mm/cycle).
6.1
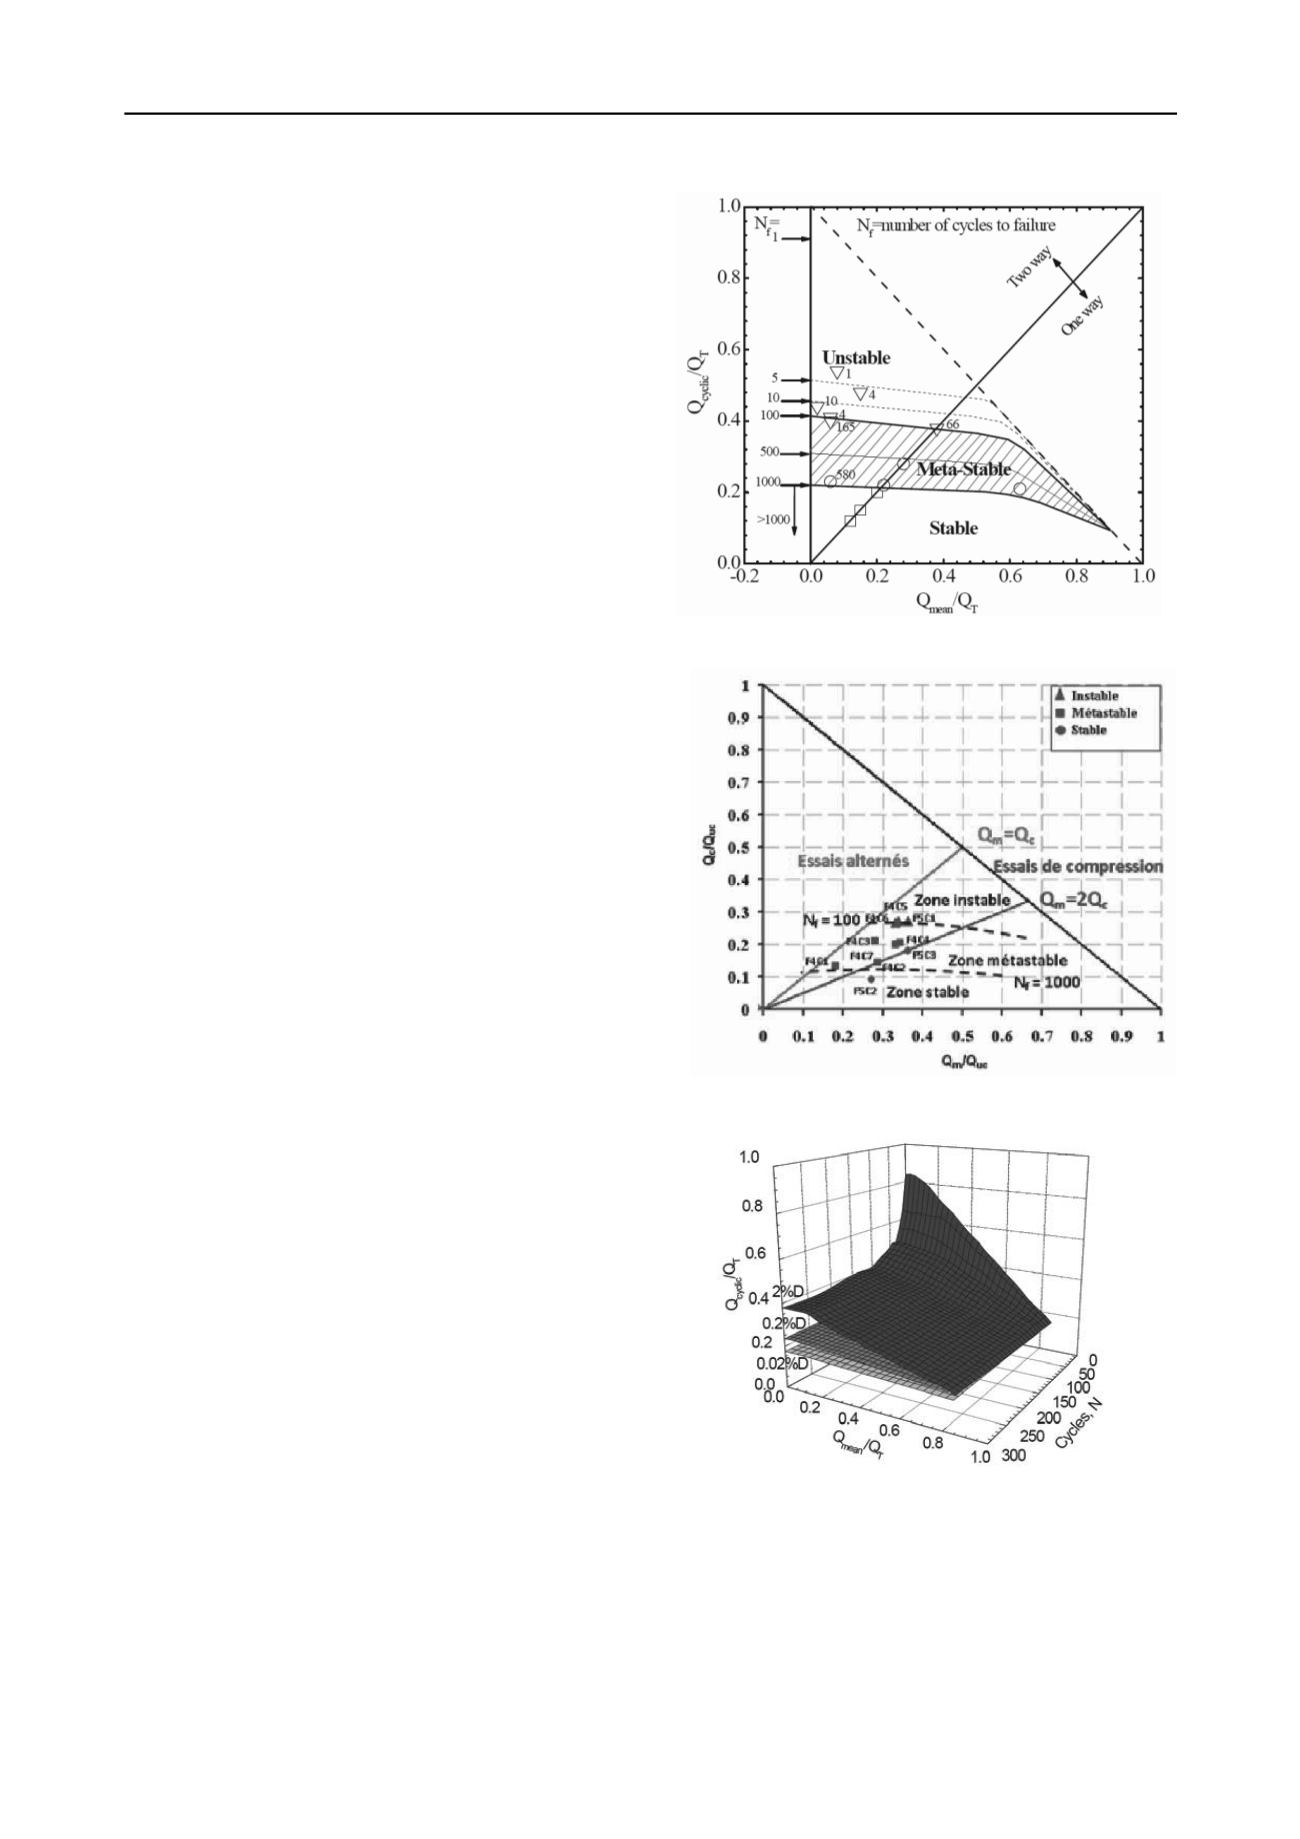
Stability diagram: cyclic axial loading
The stability diagram is a non-dimensional map for cyclic pile
behavior. The diagram in Figure 16 is for axial tension tests on
model driven piles in dense sand in a calibration chamber (Silva
et al, 2013). A similar diagram is found for the equivalent field
test data (Rimoy et al, 2013). The chart defines the region of
stable cyclic load combinations for a number of load cycles to
be resisted. One way loading (
Q
mean
>
Q
cyclic
) is more stable. The
dashed line shows the limit of valid load combinations.
Puech et al (2013) provide the equivalent stability diagrams
for cyclic compression loading of bored piles in dense sand
from field and centrifuge tests. The field tests by Benzaria et al
(2013a) are shown on Figure 17. The results from centrifuge
model tests are very similar. Note that only one-way loading
was tested and the data should not be extrapolated beyond.
While bored piles in stiff clay have lower ultimate resistance
compared with driven piles, cyclic compression tests on bored
piles in over-consolidated clay indicate a much larger range of
stable load combinations compared with piles in dense sand
(Benzaria et al, 2013b).
Information on deformation can be included on the stability
diagram as shown by Rimoy et al (2013) for field tests under
cyclic axial tension on driven piles in sand, Figure 18. The data
on the accumulation of displacement with cycling shows mostly
stable behavior that suddenly degrades near the limiting number
of cycles, a rather “brittle” behavior under tensile load.
A consistent observation for driven piles in dense sand is that
stable cycling increases the ultimate capacity when tested
subsequently. This is attributed to densification with some
relaxation in lateral effective stress around the pile, as measured
in the exceptional data of Silva et al. (2013). Conversely, strong
cyclic loading (as would lead to instability) acts to reduce the
ultimate axial pile capacity that can be mobilized subsequently.
Data on large axial pile tests in silt on a 4.2m long test pile
are also interpreted in a stability diagram by Chen et al (2013).
6.2
Cyclic lateral loading
Rosquoët et al (2013) report data on lateral displacement for
model driven piles in sand tested under one-way loading at 40g
in a centrifuge. As in §2.3.3, but for displacement rather than
rotation, the lateral displacement
y
N
compared with the first
load
displacement
y
1
[
Δy
N
= y
N
– y
1
] is linked with the number
of cycles. A logarithmic form
Δy
N
/ y
1
= c.ln(N
)
fits the data
well where
c
varies with the amplitude of cyclic load and the
maximum lateral load (equivalent to 2
Q
cyclic
/ Q
max
in the axial
terminology above, written as
DF/F
by Rosquoët et al). Based
on their test data the authors
suggest
c
=
0.1(DF/F)
0.35
as a
general fit, but sand and pile properties might also be important.
(Tsuha et al (2012) calibration chamber tests)
Figure 16: Stability diagram: tension tests on model driven piles in sand.
(Puech et al, 2013)
Figure 17: Stability diagram: field compression on bored piles in sand.
(Rimoy et al, 2013 field tension tests on driven piles in sand)
Figure 18: Stability diagram: accumulated displacement.
The natural logarithm form has the advantage of fitting the data
through to low numbers of cycles (recall §2.3.3). Rosquoët et al
(2013) also note that the maximum moment in the pile does not
increase significantly with lateral cyclic loading. Finally, the
work to extend
p-y
analysis for laterally loaded piles failed to
capture the measured behavior beyond the first few cycles.


