2298
Proceedings of the 18
th
International Conference on Soil Mechanics and Geotechnical Engineering, Paris 2013
monopile and sand parameters, presumably including the
installation process. The rate of accumulation appears not to
depend markedly on the applied load magnitude. The analysis
in §6.2 suggests that the data might also fit with a natural
logarithm through to low numbers of cycles (
Δθ
N
/ θ
1
) = c.ln(N).
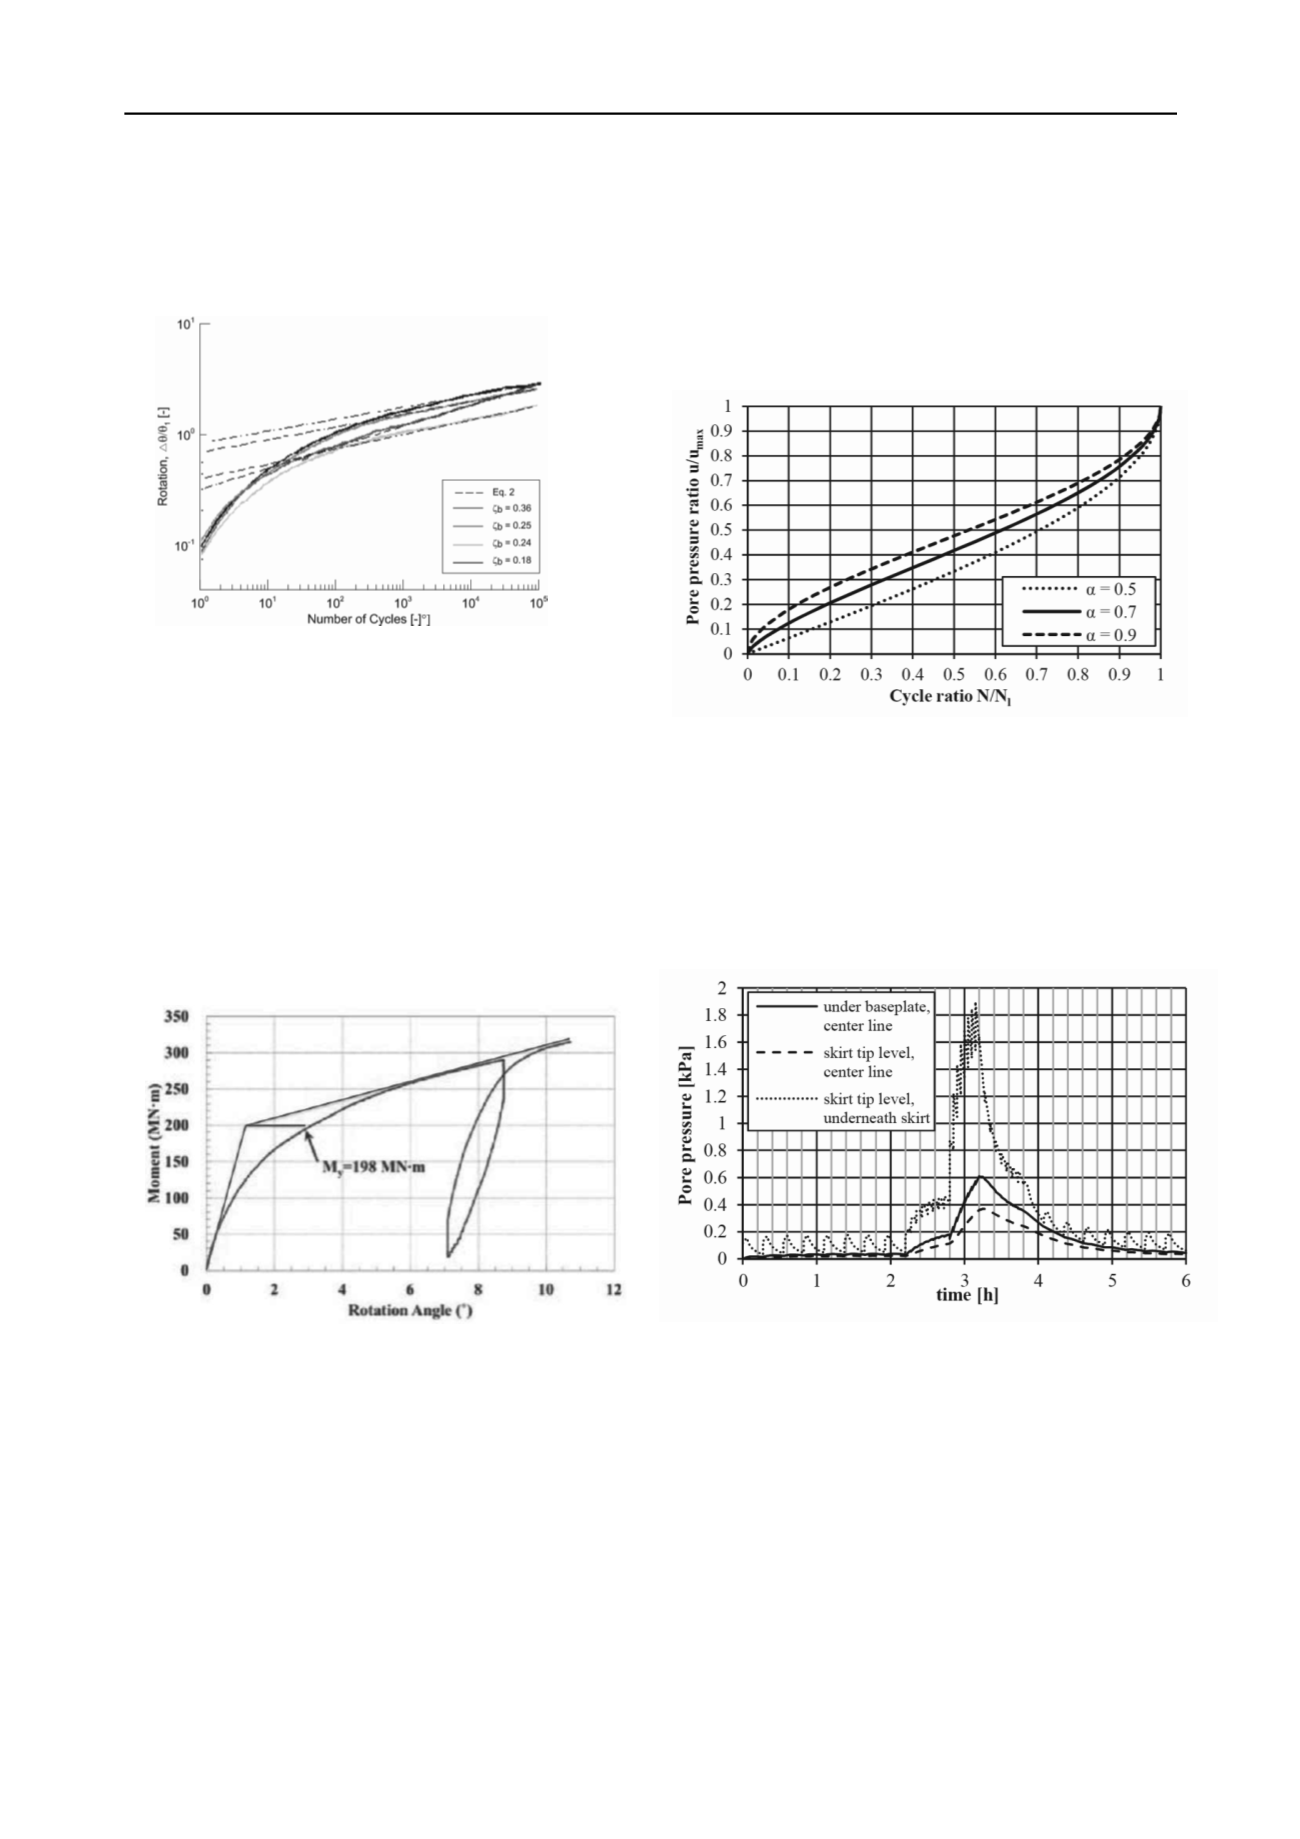
(Roesen et al 2013)
Figure 7. Monopile rotation versus number of cycles.
2.3.4
Caisson foundations
A centrifuge test of a caisson in sand is reported by Kim et al.
(2013). The caisson response to single combined load to failure
is measured and numerical analysis applied. The test details are
provided elsewhere and it is not clear whether the 1/70
th
scale
caisson was installed by suction during the centrifuge test or
before testing. Soil material from the proposed site is used to
model a planned prototype caisson foundation. The measured
response of the modelled prototype 15.5m diameter 10.5m long
caisson is shown on Figure 8 in terms of applied moment versus
rotation.
The authors report a parametric analysis using FLAC to
show the significant influence of the assumed elastic modulus
and cohesive strength parameters assumed for the soil.
(Kim et al 2013)
Figure 8. Measured moment-rotation for prototype caisson.
The offshore design standard DNV-OS-J101 (DNV, 2011)
requires structures to resist a 50 year design storm considering
both peak loads and the entire history of cyclic loading. It is
this latter requirement that is tackled by Versteele et al (2013)
for the case of caisson foundations in sand.
Because a full analysis of cyclic loading of caissons in sand
is not practically feasible with current numerical methods, the
authors develop an analysis to provide insight into the
competing processes of excess pore water pressure generation
and dissipation during the design storm. The analysis breaks
the storm into several packages of cyclic loading (magnitude,
number of cycles and time). The excess pore water pressure
generated at each point in the soil by the package of cyclic
loading is computed analytically and input into the numerical
analysis. The dissipation and redistribution of pore water
pressure during the time period is computed numerically. The
process is repeated for the next package of cyclic loading, and
so on.
The analysis for pore pressure generation uses two relations
for the sand material. First the measured cyclic shear strength
versus number of cycles to liquefaction,
N
l
, from cyclic
laboratory tests; second an empirical formula linking pore water
pressure generation to number of load cycles, Figure 9.
Liquefaction occurs at
u/u
max
= 1 when
N/N
l
= 1.
(Versteele et al 2013)
Figure 9. Generation of excess pore water pressure.
The results of a 3D analysis for a caisson foundation are
reported to illustrate the method, Figure 10. The 20m diameter
by 10m length caisson is subjected to a 6 hour design storm of
2160 waves. These are split for analysis into 5 individual load
packages. The direction of wind and wave loading is assumed
to be aligned. The results illustrate the asymmetric nature of
pore water pressure generation that has potential consequences
for possible differential settlement and tilting of the caisson.
(Versteele et al 2013)
Figure 10. Example of excess pore water pressure below a caisson.
Versteele et al
(2013)
conclude that the model is useful in
predicting areas beneath the caisson prone to the development
of excess pore pressure. However, the analysis does not predict
liquefaction behaviour or compute settlement, nor does it allow
for load redistribution in the caisson due to the changing
effective resistance in the soil during the design storm. There is
further development work to be done.
3 PIPELINES AND LARGE DISPLACEMENT.
A challenging feature for offshore pipelines is the large
displacement that can occur during installation and service.
Large displacement is particularly extreme for laying pipe on a
soft seabed. Large displacement also results from multiple
cycles of heat expansion and contraction of the operating
pipeline. This requires engineering design to avoid localized


