2282
Proceedings of the 18
th
International Conference on Soil Mechanics and Geotechnical Engineering, Paris 2013
in others they are more closely aligned with the definition of
high speed roads. The results reported here are for high speed
roads.
2.2 Damage states
Representative damage states associated with the consequences
of a debris flow of a given volume intersecting a road were
defined. The damage states considered in the questionnaire are
defined in Table 1 and range from the type of damage that is
unlikely to significantly affect the passage of vehicles, at least
on high speed roads, to that which causes longer term damage
and restrictions to the speed and/or passage of traffic.
Respondents to the survey were requested to use their expert
judgement to assess the probability of each damage state being
exceeded (Table 2) for a given event size. Respondents were
asked to use the qualitative descriptors ‘Highly Improbable’ and
‘Extremely Likely’ with caution, and only where an extensive,
high quality dataset supports the classification.
Table 1. Damage state definition.
Table 2. Description of probabilities.
Qualitative
Descriptor
Description
Value for
Analysis
Highly
improbable
Damage state almost certainly not
exceeded, but cannot be ruled out
0.000001
Improbable
(remote)
Damage state only exceeded in
exceptional circumstances
0.00001
Very unlikely Damage state will only be exceeded in
very unusual circumstances
0.0001
Unlikely
Damage state may be exceeded, but would
not be expected to occur under normal
circumstances
0.001
Likely
Damage state expected to be exceeded
under normal circumstances
0.01
Very likely
Damage state expected to be exceeded
0.1
Extremely
likely
Damage state is almost certainly exceeded
1.0
3 RESULTS
The questionnaire was sent to 176 experts; 47 responses (27%)
were received from 17 countries: UK (34%), Greece (23%),
other European countries (26%), Asia (4%), Australasia (4%),
North America (4%) and the Middle East (2%). The
respondents’ backgrounds were Academia (32%), the
Commercial Sector (51%) and Government Bodies (17%).
4 ANALYSIS
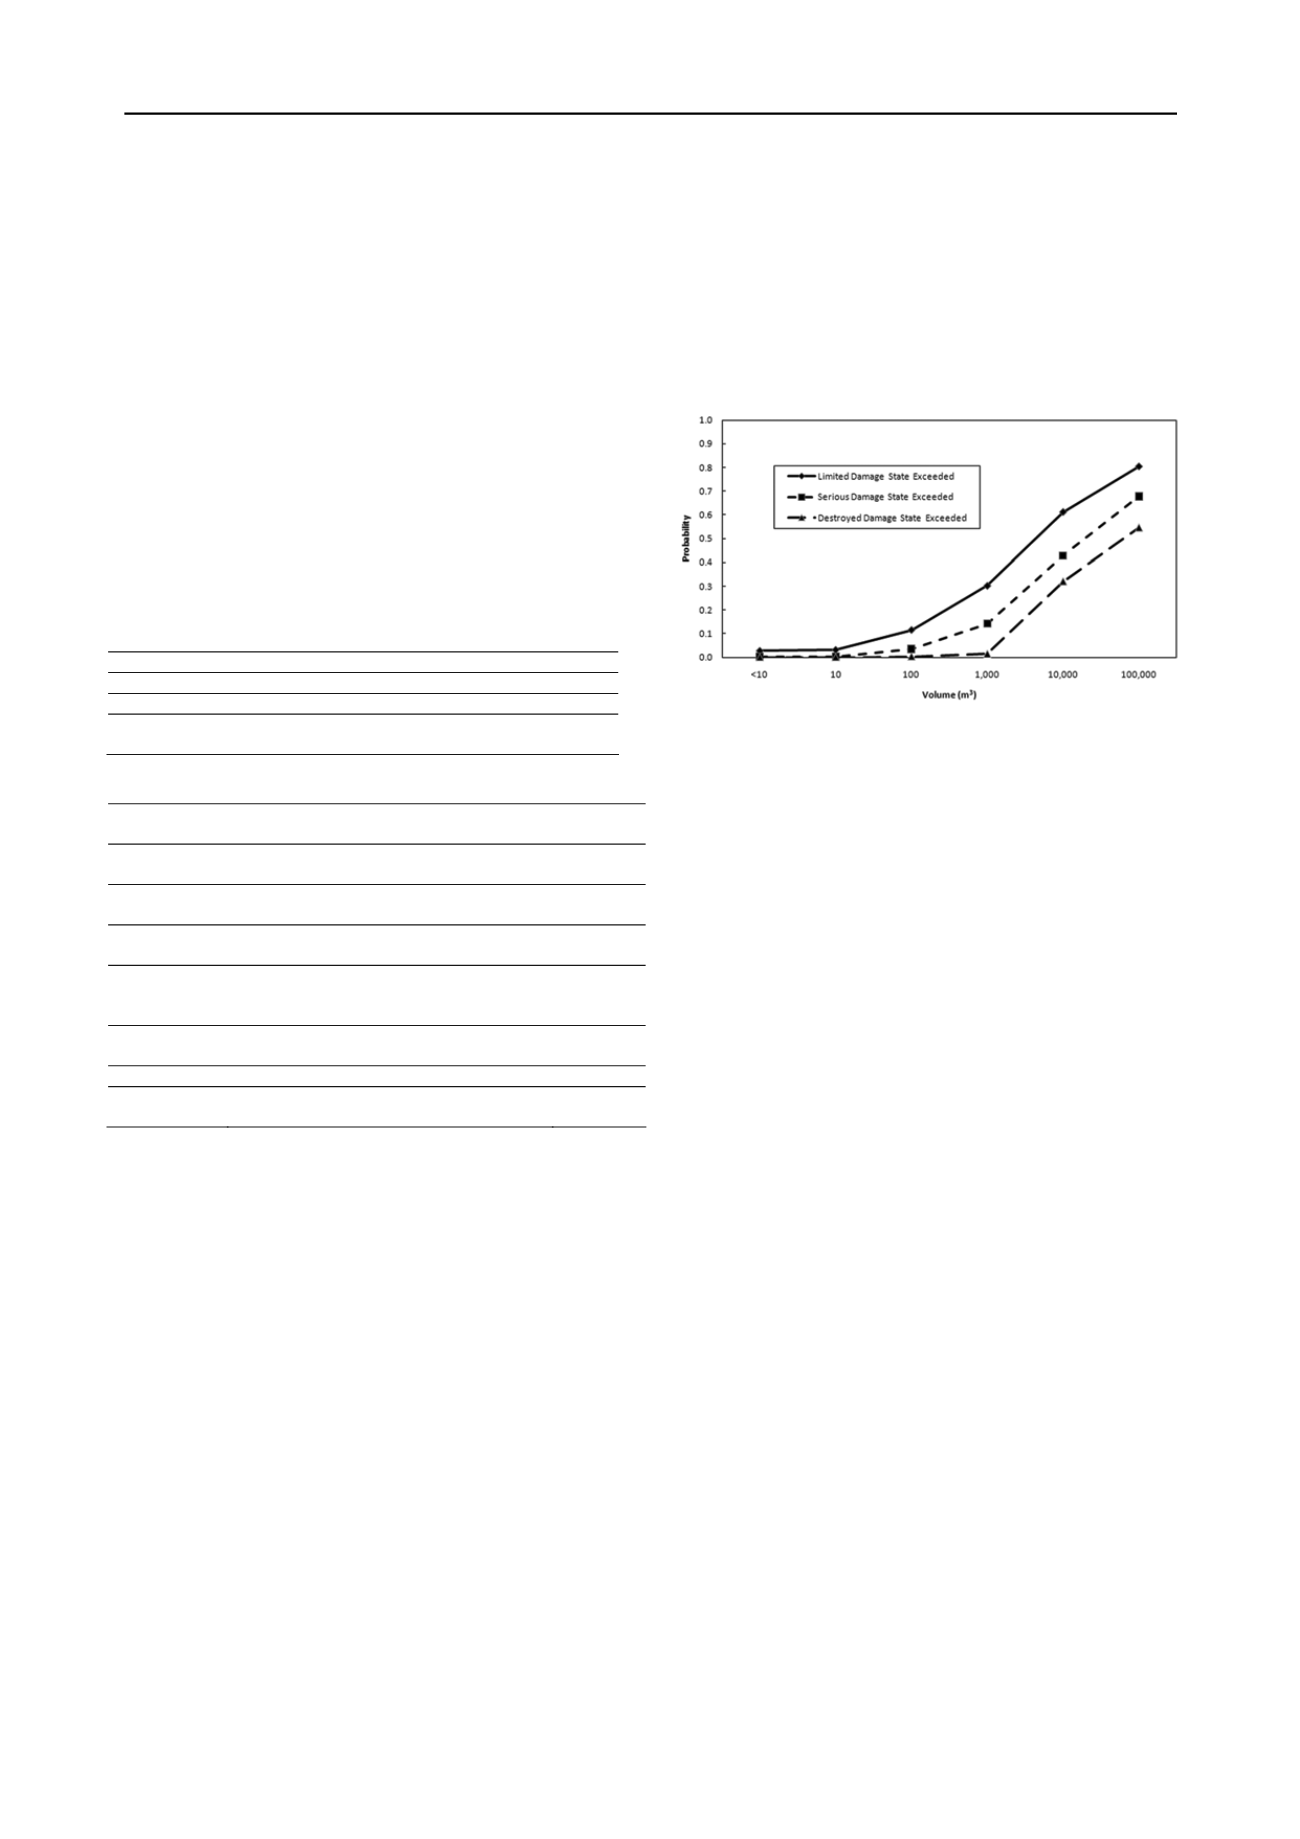
4.1 Preliminary fragility curves
It is a relatively straightforward matter to construct preliminary
fragility curves from the average of the probability responses at
each volume, at each damage state and for both high speed
roads and local roads as illustrated in Figure 1. These curves
have the basic attributes of typical fragility curves. In broad
terms these curves and the data that underpin pass the sense test.
The curves generally show that landslides of a given volume are
associated with higher probabilities of exceeding a certain
damage state when they affect local roads than when they affect
high speed roads, as would be expected. In addition, the curves
for high speed roads generally show little effect at small
landslide volumes, below a few hundred cubic metres.
It is noticeable that the mean probabilities do not reach unity
for any of the curves. This implies that the damage states as
defined can never be met or exceeded with complete certainty.
However, this is an inevitable function of using the average of
the responses, as the maximum possible response coincides with
the desired termination point of each curve (a volume at which
exceeding the given damage state is inevitable and the
probability is unity). Further stages of analysis were undertaken
to interrogate and better understand the data.
Figure 1. Preliminary fragility curves for high speed roads.
4.2 Curve fitting
Standard Excel
TM
curves were fitted (third order polynomial for
Limited Damage and fourth for Severe Damage and Destroyed
states). This gave better separation of the individual curves than
is shown in Figure 1, and there was greater contrast between the
results for high speed and local roads (Pitilakis & Fotopoulou
2011). This technique allows a degree of extrapolation of the
data to higher volumes/probabilities. However, over application
of such extrapolation tends to distort the curves at lower
volumes.
4.3 Manual extrapolation
The data presented in Figure 1 may be manually extrapolated by
a further logarithmic cycle by visually judging the appropriate
value of probability at 1,000,000m
3
in order to maintain the
broad appearance and trend of the curves. It is noticeable that,
even when the volume is increased to 1,000,000 m
3
in this way
none of the fragility curves reach unity; only that for Limited
Damage for local roads reaches a value of around 0.95.
4.4 Weighting the data
Clearly the experience of the respondents is a critical metric in
terms of understanding, evaluating, analysing and interpreting
these data. The respondents were asked to assess their
experience on a scale of zero (no experience) to 10 (extensive
experience). The scores of this self-assessment weight towards
the higher end of the range, as might be expected from a sample
of respondents who were selected for their known expertise in
this area. It thus seems potentially appropriate to place a greater
confidence in the responses received from those who reported
that their level of experience was higher than the average and a
number of approaches is possible.
Firstly, a weighting approach may be taken. However, care
is needed to ensure that the sample is weighted rather than the
individual responses; otherwise bias will be introduced into the
results. (Weighting the individual responses will, depending
upon the precise approach taken, either increase or decrease the
individual probabilities contained within the questionnaires for
those with higher expertise and the converse for those with
lower levels of expertise. There is no logical justification for
such a change and this should therefore be avoided.) Weighting
the sample may be done as follows
Damage State
High Speed Roads
P1 (Limited damage) Encroachment limited to verge/hardstrip
P2 (Serious damage)
Blockage of hardstrip and one running lane
P3 (Destroyed)
Complete blockage of carriageway and/or
repairable damage to surfacing


