2284
Proceedings of the 18
th
International Conference on Soil Mechanics and Geotechnical Engineering, Paris 2013
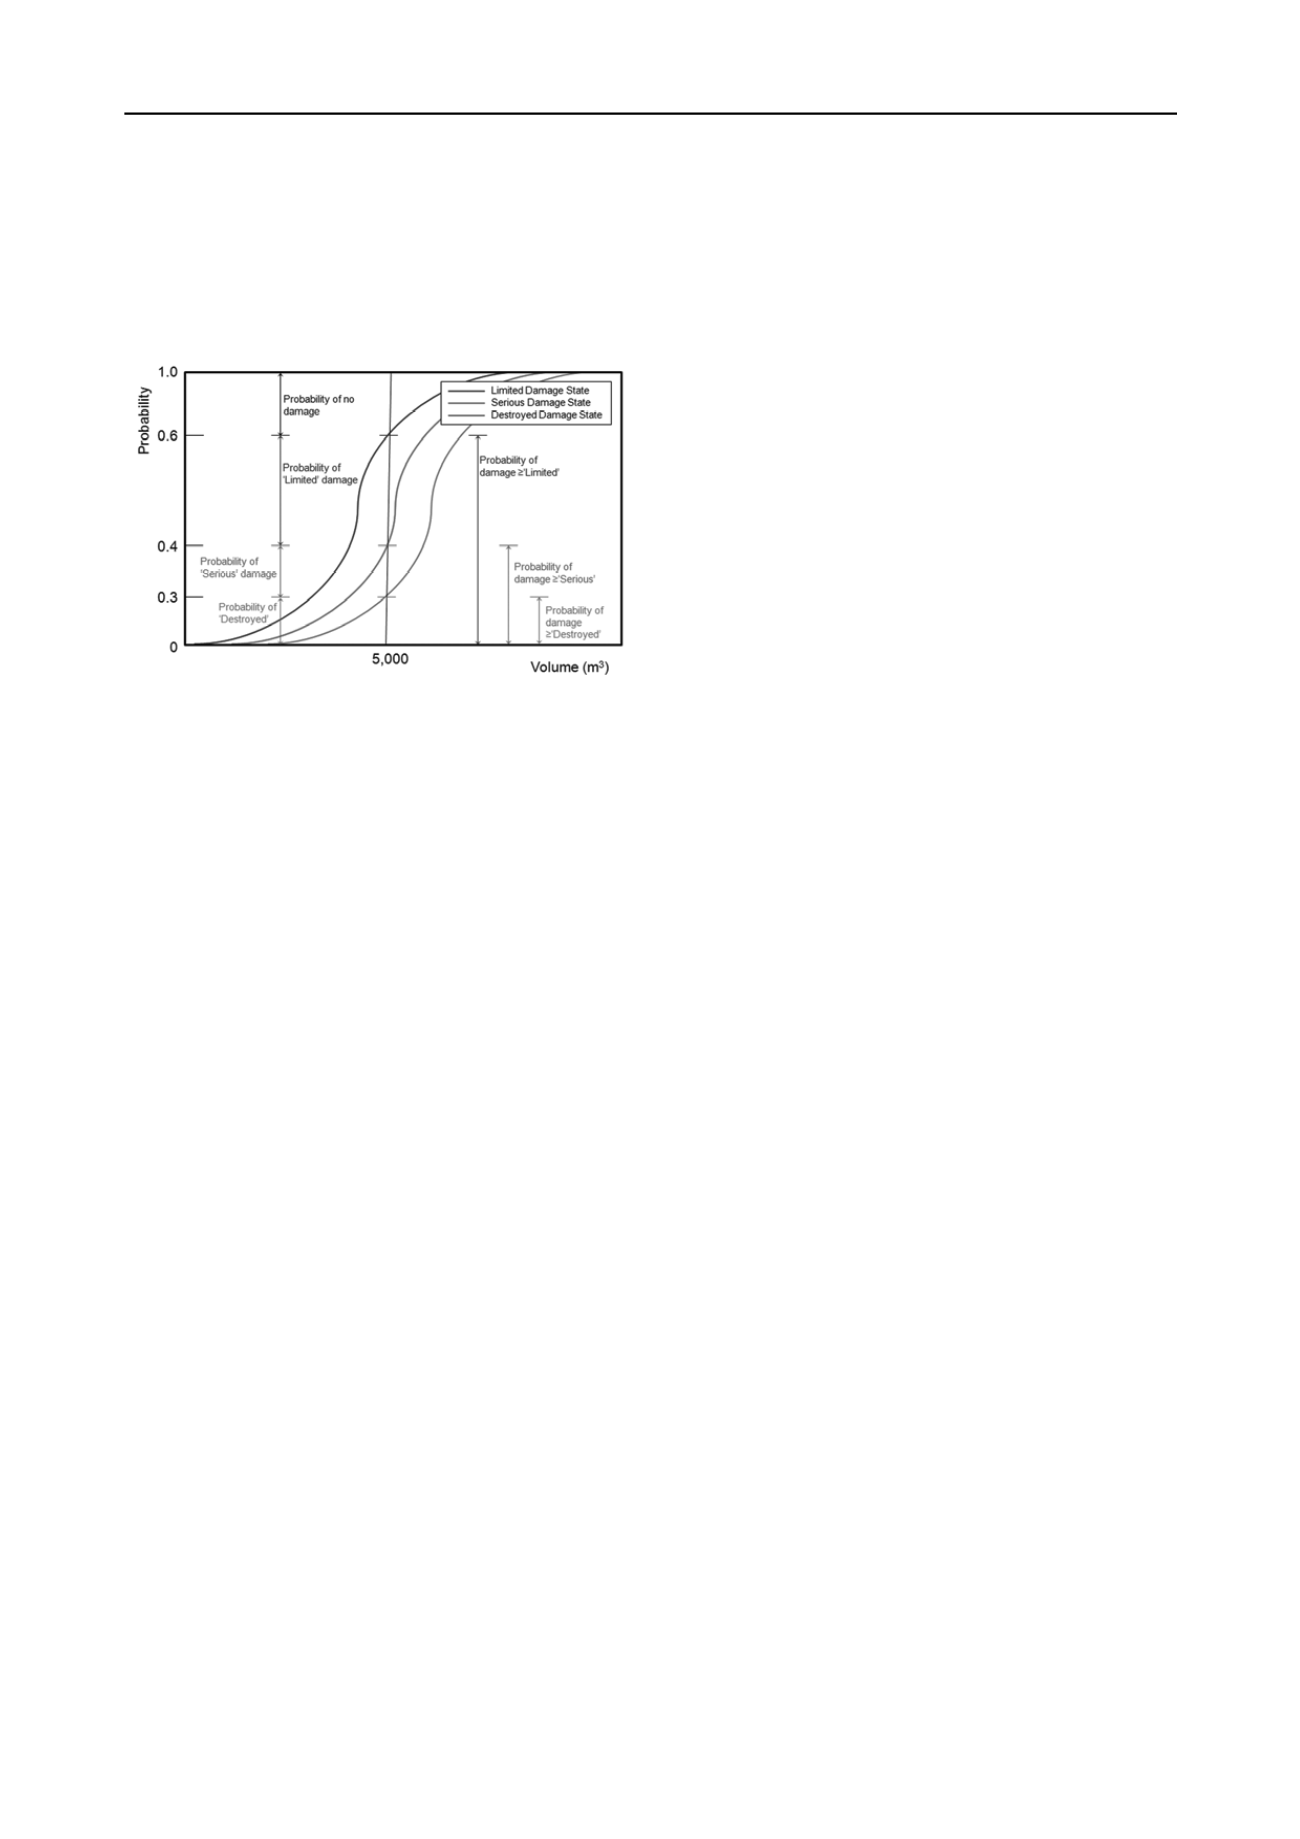
Note that the conditional probability of the ‘Destroyed’
damage state is always equal to the probability of that state
being exceeded. Vulnerability assessment using fragility curves
is, of course, probabilistic in nature and the models used in their
construction – in this case based upon expert judgment – have
inherent uncertainties. Accordingly, the validation examples are
not expected to precisely predict the observed damages.
Figure 4. Hypothetical fragility curves: the numbers relate to a 5,000m
3
event on a high speed road (see Figure 3) and show conditional
probabilities and those of a given event exceeding a damage state.
6.1 A85 Glen Ogle, Scotland
In August 2004 two debris flow events occurred at Glen Ogle
blocking the A85 strategic road, culverts and other drainage
features, and necessitated a full repair to the road pavement,
safety barriers and parapets. Some 20 vehicles were trapped by
the events and 57 people were airlifted to safety; one vehicle
was swept away in the latter stages of the event (Winter et al.
2005, 2006, 2009). The smaller southerly and larger northerly
events were estimated to have deposited around 3,200m
3
and
8,500m
3
in their respective debris lobes having been triggered
by smaller translational slides of around 285m
3
and 280m
3
(Milne et al. 2009). These figures are believed to exclude
material deposited on the road and it seems reasonable therefore
to round these figures up to around 5,000m
3
and 10,000m
3
. This
illustrates the uncertainty when dealing with debris flow
volumes between the amount mobilised and that deposited at
road level.
Figure 4 shows how these event volumes plot on the
fragility curves. For the smaller (5,000m
3
) event the conditional
probabilities for no damage, ‘Limited’, ‘Serious and
‘Destroyed’ damage states are 0.4, 0.2 (0.6), 0.1 (0.4) and 0.3
(0.3) (the probabilities of the damage states being met or
exceeded are given in parentheses); for the larger (10,000m
3
)
event the conditional probabilities are around 0.3, 0.15 (0.7),
0.15 (0.55) and 0.4 (0.4). Certainly the damage caused by the
larger event would have been described as ‘Destroyed’ using
the scheme considered here and the probability of this state
being 0.4 seems to be broadly in line with observations in its
immediate aftermath, affecting a road length of around 200m.
Similarly the damage caused by the smaller event, although
significantly less in terms of physical damage to the
infrastructure, would also be classified as ‘Destroyed’ and this
seems to broadly reflective the probability of 0.3 (Figure 4).
6.2 Chuncheon National Highway, Republic of Korea
Debris flows of around 500m
3
to 1,000m
3
were evident at the
Chuncheon National Highway Tunnel Portals (Lee & Winter,
2010). For an event of this volume (1,000m
3
) the conditional
probabilities of the damage states no damage, ‘Limited’,
‘Serious’, and ‘Destroyed’ are 0.7, 0.1 (0.3), 0.18 (0.2), and
0.02 (0.02) (Figure 4).
Only very minor damage was incurred and this reflects the
small volumes and the combined conditional probabilities of 0.8
for no damage and of the ‘Limited’ damage. The road was not
open at the time of the event and there is every possibility of
both further and larger events that have the potential to meet or
exceed higher damage states.
7 CONCLUSIONS
A survey of experts was conducted to develop of preliminary
fragility curves for the effects of debris flows on roads.
Included in the questionnaire was the opportunity for the
respondents to make ‘free text’ responses to defined questions.
Their responses have been used, in part, to determine the form
of analysis. Consequently the proposed fragility curves have
been extrapolated to include events one order of magnitude
greater than the largest considered in the questionnaire. In
addition, this form of determining fragility curves renders it
almost impossible for the probabilities to range from zero to
unity; according the proposed fragility curves have been
stretched to ensure such a spread.
The derived fragility curves have been compared to known
events in Scotland (UK) and the Republic of Korea. In general
the curves tend to give results that might be deemed ‘sensible’
with probabilities of around 0.3 to 0.8 being suggested for the
known damage states. Exceptions to this occur when detailed
site characteristics introduce complexities that are not, and
could not be, accounted for in the analysis.
Notwithstanding this, the method of data acquisition and the
perceived interpretations of the questionnaire for this first
approach raise some interesting issues that will be explored in a
later paper. Continued efforts are needed, potentially including
the use of modelled and empirical data.
8 ACKNOWLEDGEMENTS
The work described in this paper was (partially) supported by
the European Commission through the project “SafeLand –
Living with landslide risk in Europe: Assessment, effects of
global change, and risk management strategies” of EU’s 7th
Framework Programme. Their support is gratefully
acknowledged. The TRL authors gratefully acknowledge
additional funding from Transport Scotland.
9 REFERENCES
Lee, S.-G. & Winter, M.G. 2010. The effects of debris flow in the
Republic of Korea and some issues for successful management and
mitigation. In A.L. Williams, G.M. Pinches, C.Y. Chin, T.M.
McMorran & C.I. Massey (eds.),
Geologically Active: Proceedings,
11th IAEG Congress
, 1243-1250. London: CRC Press.
Mavrouli, O. & Corominas, J. 2010. Rockfall vulnerability assessment
for reinforced concrete buildings,
Natural Hazards and Earth
System Sciences
10, 2055-2066.
Milne, F. D., Werritty, A., Davies, M. C. R. & Browne, M. J. 2009. “A
recent debris flow event and implications for hazard management”,
Quarterly Journal of Engineering Geology and Hydrogeology 42,
51-60.
Pitilakis, K., Alexoudi, M., Argyroudis, S., Monge, O. & Martin, C.
2006. Earthquake risk assessment of lifelines.
Bulletin of
Earthquake Engineering
4
, 365-390.
Pitilakis. K. & Fotopoulou, S. (Eds.) 2011. Physical vulnerability of
elements at risk to landslides: methodology for evaluation, fragility
curves and damage states for buildings and lifelines. SafeLand
Deliverable 2.5.
.)
Winter, M. G., Macgregor. F. & Shackman, L. (Eds.) 2005. Scottish
Road Network Landslides Study, 119p. Trunk Roads: Network
Management Division Published Report Series. Edinburgh: The
Scottish Executive.
Winter, M. G., Heald, A. P., Parsons, J. A., Macgregor, F. & Shackman,
L. 2006. Scottish debris flow events of August 2004, Quarterly
Journal of Engineering Geology and Hydrogeology 39, 73-78.
Winter, M.G., Macgregor, F. & Shackman, L. (Eds.) 2009.
Scottish
road network landslides study: implementation
: 278p. Transport
Scotland Published Report Series. Edinburgh: Transport Scotland.


